Blog

  • 5E Advanced Materials Publishes Fort Cady Project SK-1300 Pre-Feasibility Technical Report with a US$724.8M Pre-Tax NPV7, 19.2% IRR, Initial 39.5-Year Mine Life

    5E Advanced Materials Publishes Fort Cady Project SK-1300 Pre-Feasibility Technical Report with a US$724.8M Pre-Tax NPV7, 19.2% IRR, Initial 39.5-Year Mine Life

    Technical Report Underscores Large, Multi-generational
    High-Grade Colemanite Deposit to Support Domestic Supply of 
    Boron Amid Growing Demand

    HESPERIA, CALIFORNIA / ACCESS Newswire / August 7, 2025 / 5E Advanced Materials, Inc. (“5E” or the “Company”) (Nasdaq:FEAM)(ASX:5EA), a boron and lithium company designated as Critical Infrastructure by the U.S. Department of Homeland Security, is developing one of the world’s largest new conventional boron deposits through a vertically integrated platform, is pleased to announce the completion of the Preliminary Feasibility Study (the “Technical Report”) for the Company’s Fort Cady Project (the “Project”) located in the Mojave Desert, near the town of Newberry Springs, California.

    The Project underpins 5E’s strategy to become a vertically integrated global supplier of critical and industrial materials through in-situ extraction of colemanite, from which the Company intends to produce boron and calcium-based products which will support global electrification, energy, food security, and critical defense applications.

    Highlights of the Pre-Feasibility Study

    • Technical Report is specifically focused on Phase 1 of the Project, converting 41% of the resource into 5.4M tons of boric acid (H3BO3) reserves yielding 39.5-year life of mine

    • Total Mineral Reserves of 5.4M tons boric acid with grade of 8.03% (B2O3)

    • Technical Report ONLY includes Phase 1 production and presents robust economics with forecasted pre-tax net present value (NPV7) of US$724.8 million and 19.2% unlevered IRR

    • Project retains optionality for future expansion phases of additional production tonnage and value-added boron derivatives

    • The initial Phase 1 plant targets delivery of 130,000 tons per year of boric acid production, approximately ~11% of global boric acid demand today

    • Mining permits in place with the colemanite reserve mined using an in-situ leaching (“ISL”) method, thereby minimizing the surface land disturbance required for the Project facilities

    • The expected initial project capital cost (inclusive of a gas COGEN facility) is US$367M for Phase 1 plus US$55M contingency (15%) and US$13M of owner’s cost

    • By-product mix includes calcium chloride and gypsum with expected all-in sustaining cash (including logistics) of US$554.80 per ton of boric acid

    • Market study indicates tight supply with demand forecasted to exceed supply in 2026 driving boric acid prices higher

    • Revenue from production will primarily be derived from boric acid sales, approximately 94% of total revenue, while by-products of calcium chloride and gypsum will provide approximately 6% of total revenue

    The Technical Report, which outlines an initial mine life of 39.5 years, confirms the strong economics of an ISL operation that would initially produce 130,000 short tons per year of boric acid along with calcium-based by-products; calcium chloride and gypsum. This Technical Report only includes Phase 1 of the Project, with optionality for phased expansion of additional tonnage and value-added boron derivatives.

    The Company commenced mining operations in January 2024 and currently has a small-scale facility (“SSF”) that began operation in April 2024, which has provided invaluable operational data that has been incorporated into the basis of design for the Project. The SSF has achieved a steady state of production for boric acid and gypsum in addition to qualifying 14 customers who have set the stage for continued offtake negotiations. Most recently, two injection-recovery wells were converted to horizontal wells intercepting approximately 3,000 feet of high-grade colemanite.

    “This technical report validates the economic strength and strategic importance of the Fort Cady Project,” stated Mr. Paul Weibel, Chief Executive Officer of 5E Advanced Materials. “With strong projected economics underpinned by meticulous technical work, we are now positioned to move into definitive feasibility planning, FEED-engineering and long-term project financing with the right team who have been critical in reaching this point in the development cycle. I am very pleased with 5E’s team and partners work to deliver this report. We have mined and processed for the last 18-months and have qualified product with over 14 large global end users. As we target large-scale commercial production in 2028, we look toward the economic potential of the Project, which we expect will provide high paying jobs in California and be a significant long-term U.S. producer of boron to maintain the security of the boron supply chain in the United States.”

    5E will host a conference call to discuss the results of the Technical Report on Tuesday, August 12, 2025, at 5:00 p.m. EDT (2:00 p.m. PDT). The call will be hosted by 6ix with remarks from Mr. Paul Weibel, Chief Executive Officer of 5E Advanced Materials, Inc.

    To participate, note the following:

    DATE: August 12, 2025
    TIME: 5:00 p.m. EDT (7:00 a.m. AEST on August 13, 2025)
    LINK:Registration (https://6ix.com/event/5e-advanced-materials-market-update-1)

    Details of the Pre-Feasibility Technical Report

    The Technical Report summary results are presented in Table 1.

    Table 1. Project Summary

    Description

    Units

    Total/Amount

    Mine Life

    Years

    39.5

    Reserves B2O3 (tonnage)

    Tons (short)

    3,003,955

    Reserves H3BO3 (tonnage)

    Tons (short)

    5,335,023

    Reserves B2O3 (grade)

    %

    8.03%

    Recovery B2O3 (in-situ)

    %

    81.9%

    Mining Efficiency (drilling)

    %

    95.0%

    Recovery B2O3 (processing)

    %

    95.1%

    Table 1. Project Summary (Continued)

    Production

    Annual Production (H3BO3)

    Tons (short) per year

    130,000

    Annual Production (Gypsum)

    Tons (short) per year

    129,000

    Annual Production

    (CaCl2 ~ 38%)

    Tons (short) per year

    57,000

    Capital Costs

    Initial Capital with Contingency

    $M USD

    435.0

    Sustaining Capital

    $M USD

    39.9

    Total Capital (life of mine)

    $M USD

    474.8

    Operating Costs (Full-Run Rate)

    Variable Costs

    $/t H3BO3

    405.7

    Fixed Costs

    $/t H3BO3

    222.1

    Credits

    $/t H3BO3

    (73.0)

    Net Total Costs (inclusive of logistics)

    $/t H3BO3 (net)

    554.8

    Economic Analysis

    Average Price LOM – H3BO3

    $/short ton

    1,355

    Netback Price – Gypsum

    $/short ton

    21

    Netback Price – CaCl2 ~38%

    $/short ton

    120

    Pre-Tax: Free Cashflow

    $M USD

    3,749

    Pre-Tax: NPV7

    $M USD

    725

    Pre-Tax: IRR

    %

    19.2

    After-Tax: Free Cashflow

    $M USD

    2,625

    After-Tax: NPV7

    $M USD

    469

    After-Tax: IRR

    %

    15.9

    After-Tax: Payback Period

    Years

    5.9

    Project Location

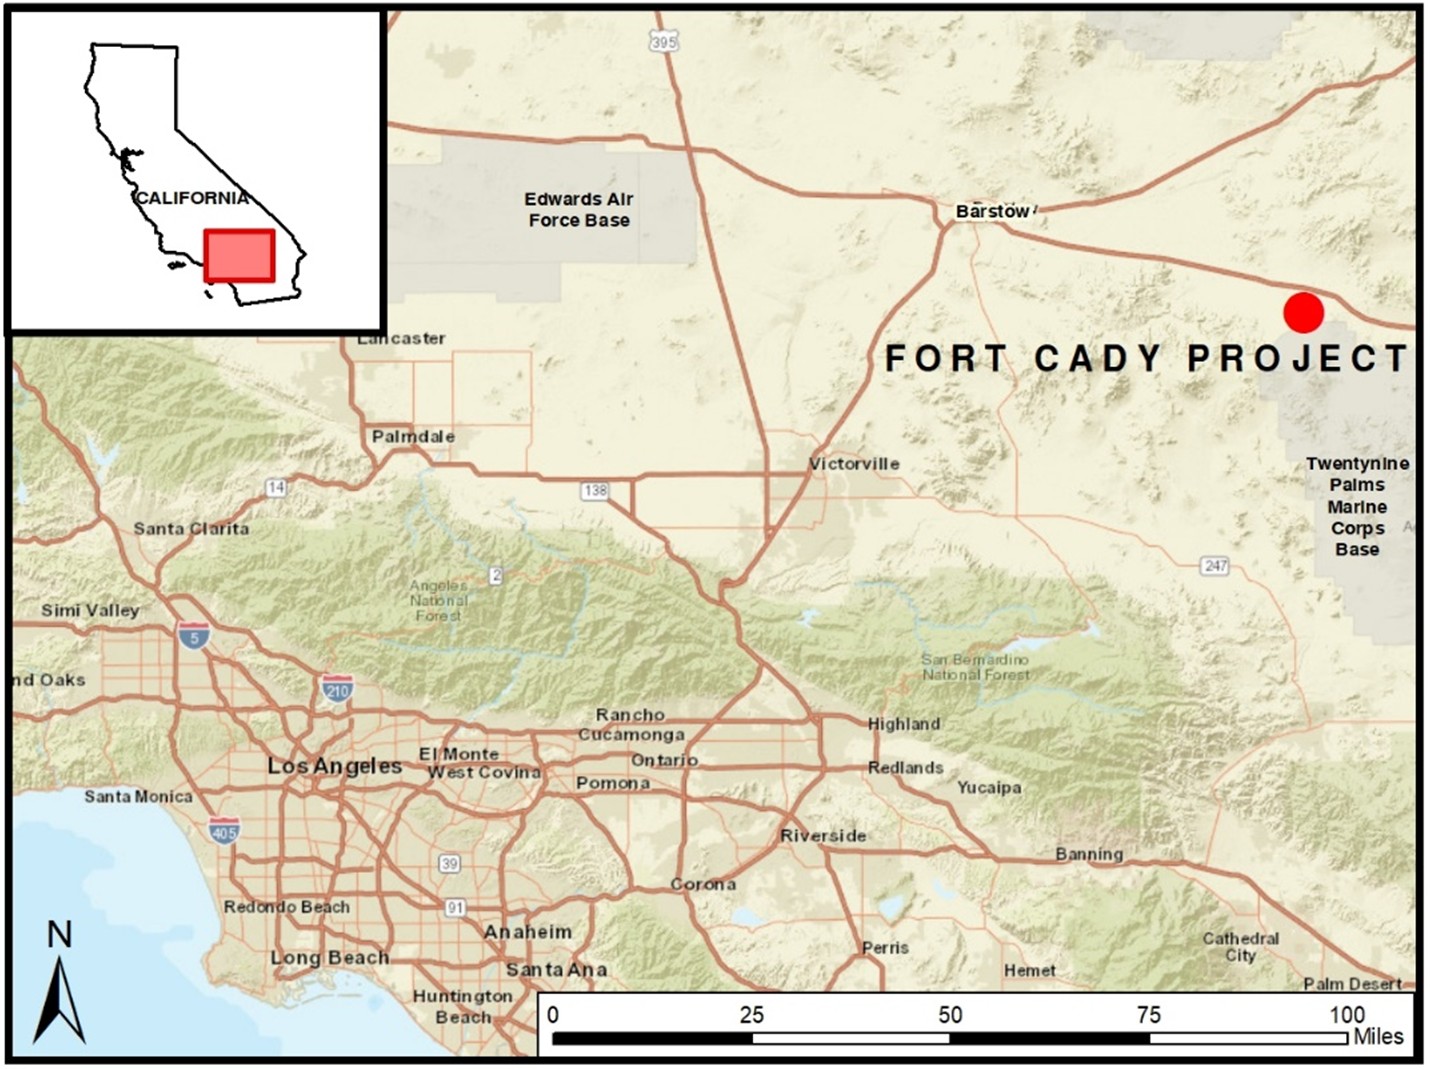
    The Project is located halfway between Las Vegas, Nevada and Los Angeles, California and includes both private and federal land. The Project is located approximately 2 miles south of Interstate 40 and approximately 25 miles east of Barstow, California. The site is connected to approximately 1 megawatt of grid power and is approximately 2 miles from major natural gas transmission lines and the BNSF rail line. Figure 1 shows the project location.

    Figure 1. Fort Cady Project Location

    Mineral Resources

    The Technical Report defines both Mineral Resources and Mineral Reserves for the Project. The Mineral Resources on lands under 5E’s mineral control include 23.5 million short tons of Measured ore containing 3.26 million short tons of in-situ boric acid, with an average grade of 7.91% B₂O₃. The Indicated category comprises 85.6 million short tons of ore containing 11.8 million short tons of in-situ boric acid, with an average grade of 7.89% B₂O₃. Mineral resources were estimated using a 2.0% B2O3 cut-off grade and Table 2 summarizes the mineral resources.

    Table 2. Fort Cady Project Mineral Resources

    *Mineral Resources

    Short Tons (MST)

    B2O3 (wt. %)

    B2O3 (MST)

    H3BO3 (MST)

    Measured

    23.50

    7.91

    1.84

    3.26

    Indicated

    85.63

    7.89

    6.66

    11.83

    Total Measured + Indicated

    109.13

    7.89

    8.50

    15.09

    Total Inferred

    4.26

    7.45

    0.31

    0.55

    *Mineral Resources that are not Mineral Reserves do not have demonstrated economic viability. Under S-K 1300, inferred mineral resources are not considered economically recoverable within the current mine plan and are excluded from the production schedule and economic analysis. Inferred Mineral Resources include areas not currently under mineral tenure control. These are disclosed for transparency but excluded from the mine plan and economic model. The Company makes no assurance that mineral rights to these areas will be secured.

    Notes to Mineral Resources:

    1. The Mineral Resources in this estimate were independently prepared, including estimation and classification, by Steven Kerr, P.G., C.P.G, Escalante Geological Services, LLC, and are reported in accordance with the definition for Mineral Resources in S-K 1300.

    2. The Mineral Resources were completed using a gridded seam model with Carlson Mining™ software.

    3. The Mineral Resources are current as of March 10, 2025.

    4. Mineral Resources are constrained assuming in-situ leaching and are reported at a cutoff grade of 2.0% B2O3, assume mineralized horizons exhibit lateral continuity that supports in-situ leaching mining methods and based on exploration data, there is reasonable continuity of colemanite mineralization throughout the deposit, respectively.

    5. Only resources located on lands under current mineral control are reflected in the mine plan and economic analysis.

    Mineral Reserves

    A detailed mine production plan was developed to support the calculation of Mineral Reserves. The mine plan and wellfield optimization are based on third-party engineering work that incorporated 19 months of actual wellfield performance data from the SSF into the design.

    Mineral Reserve assumptions, such as plant efficiency, leaching efficiency, and mining efficiency were taken into consideration to calculate the reserve estimate. The operating costs were derived from material and energy balances as well as a detailed labor build developed from first principles. The following steps and assumptions were used to calculate Mineral Reserves:

    • Measured and Indicated Mineral Resource of fee-based land and the power corridor were used as the base resource and Inferred Resources were excluded.

    • The mine plan includes a Phase 1 plan for which 5E has demonstrated mineral tenure.

    • Trade off analysis of actual vertical well performance relative to expected horizontal well performance can increase colemanite contact up to 20x with extended lateral wells and achieve permeable driven injection rates of +100 gallons per minute.

    • The surface chemical plant would deliver a 95.1% boric acid yield.

    • Leaching efficiency is 81.9% based on leach testing.

    • Solution mining efficiency is 95.0% based on the July 2025 horizontal well drill program.

    • Discounted cash flow incorporated capital and operating cost inputs.

    Mineral Reserves are reported in-situ using a 2.0% B2O3 cut-off grade. Table 3 summarizes the Mineral Reserves for the Project.

    Table 3. Fort Cady Project Mineral Reserves

    Mineral Reserves

    Average B2O3 Grade (wt. %)

    Recoverable Mineralized Bed Volume (ft3)

    B2O3 (MST)

    H3BO3 (MST)

    Proven

    8.03

    19,894,414

    0.76

    1.35

    Probable

    8.03

    58,565,846

    2.24

    3.98

    Total Reserves

    8.03

    78,460,260

    3.00

    5.33

    Notes to Mineral Reserves:

    1. The Mineral Reserves in this estimate were independently prepared, including estimation and classification, by Alan White, P.E., Miocene, Inc., and are reported in accordance with the definition for Mineral Reserves in S-K 1300.

    2. The Mineral Reserve Estimate is based on a cut-off grade of 2.0% B₂O₃. Mining recovery, mining efficiency, and process recovery factors applied were 81.9%, 95.0% and 95.1%, respectively, based on pilot-scale testing and engineering assumptions outlined in the Pre-Feasibility Study.

    3. Mineral Reserves are a subset of the Measured and Indicated Mineral Resources and do not include Inferred Mineral Resources nor any Mineral Resource for which 5E does not have mineral tenure.

    4. The Mineral Reserves are current as of August 4, 2025.

    5. Rounding, as required by the guidelines, may result in minor summation differences between tons, grade, and contained B2O3 or H3BO3 content.

    Mining Method

    The Project will be employing in-situ leaching as its mining method to recover borates from the mineralized horizons. The depth and grade of the deposit precludes conventional mining techniques such as open pit and underground mining. With ISL mining, there is no stripping of waste rock or underground development required for the Project. ISL activities include drilling and constructing of injection/recovery wells, installing pumping or airlifting extraction equipment on the wells, and piping to transport barren leach solutions to the wellfield and Pregnant Leach Solution (“PLS”) back to the chemical plant for processing.

    Based on the results of operating the SSF injection, recovery wells and work completed by 5E, the Large-scale Boron Facility (“LSBF”) calls for the installation of 27 directional wells targeting the upper mineralized horizon (“UMH”), major mineralized horizon (“MMH”), and lower mineralized horizon (“LMH”) spaced at 200-ft horizontal offset and 120 – 180-ft vertical spacing. The operating strategy of the wells will focus on high-grade mineralization zone cavern development through continuous injection and cyclic push-pull mechanics.

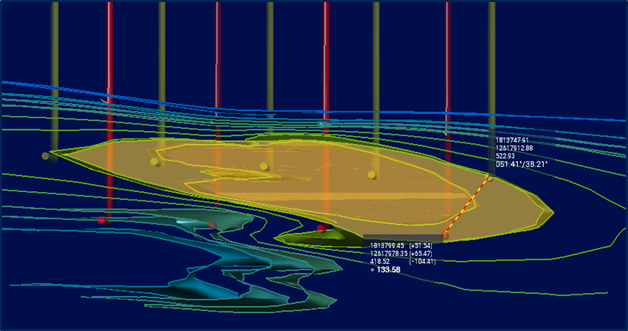
    These wells are to operate as injection and recovery wells whereby injection and recovery of lixiviant through separate horizontal wellbores and full reservoir contact is accomplished by geo-steered laterals in a “fishbone” pattern and positively intercepting each well. The leach solution (lixiviant) is pumped into the well and, after a prescribed residence time, is retrieved from the same well, or offset wells as caverns develop, for processing. This method will be used until the dissolution of the colemanite in the deposit progresses to where complete reservoir flow is established between regional groups of wells. Figure 2 details the horizontal well schematic across the deposit.

    Figure 2. Fort Cady Wellfield

    Processing and Recovery Methods

    The processing facility at the LSBF is engineered to support high-efficiency, high-throughput extraction and refinement of boric acid and associated byproducts from the PLS. 5E successfully executed an extensive program of mineral processing and metallurgical testing. Based on these results, the company has selected a proven, crystallization-based process for boric acid extraction. This method has been validated through both laboratory-scale experiments and the operational success of the SSF. The following is a description of the process steps:

    • Solution Mining and Injection: Target minerals are dissolved in-situ using solution mining techniques utilizing heat and steam. The resulting PLS is transported via pipeline infrastructure to the surface processing facilities.

    • PLS Recovery and Clarification: The PLS undergoes pH adjustment through lime addition, which reduces acidity and enables the use of more cost-effective materials of construction. A multi-stage solid-liquid separation process, including filtration, removes precipitated solids, yielding a clarified solution ready for downstream processing.

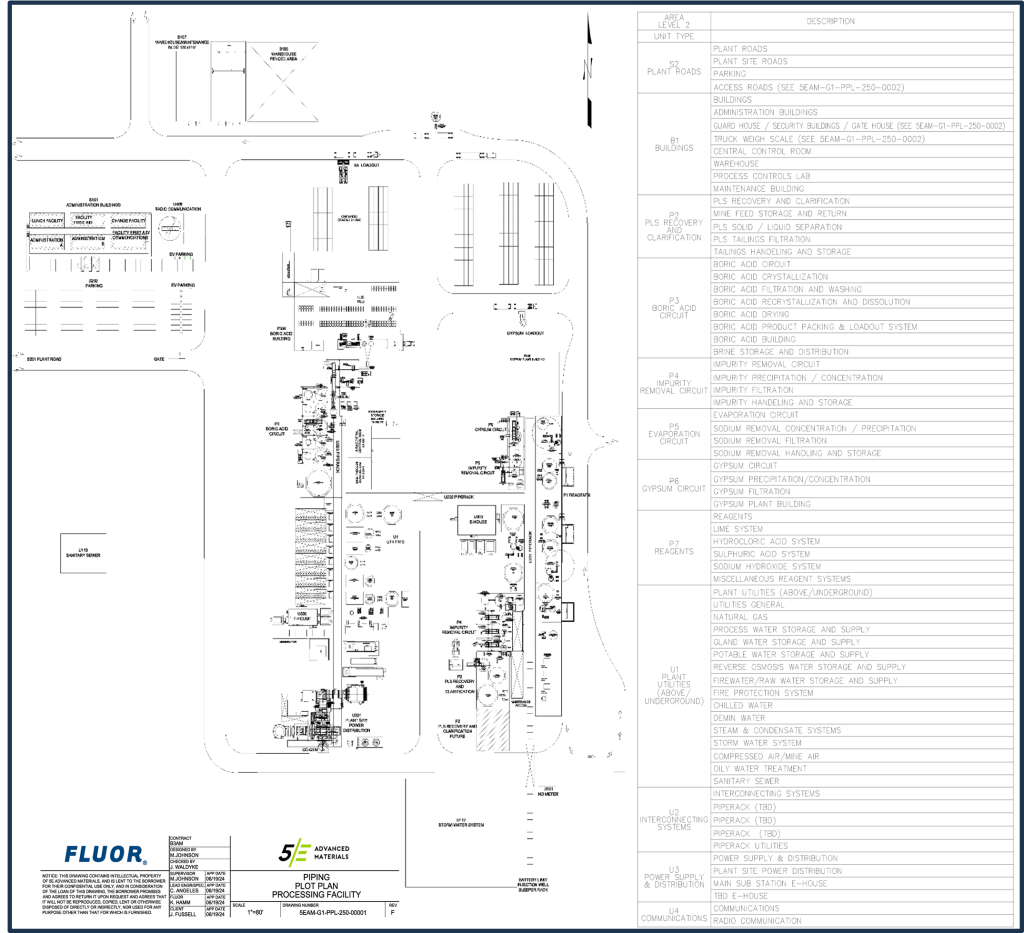
    Figure 3 Planned Site Layout

    • Boric Acid Circuit: This core section of the process is dedicated to the concentration, extraction, and purification of boric acid. A two-stage vacuum chilled crystallization system initiates the precipitation of boric acid, followed by filtration, washing, and redissolution. A second two-stage recrystallization step ensures high-purity product formation. Final dewatering is achieved via centrifugation, and the wet crystals are dried in a rotary dryer, cooled, and packaged. A portion of the centrate is directed to the Impurity Removal Circuit and the remainder is sent to the Gypsum circuit.

    • Impurity Removal Circuit and Evaporation: In the Impurity Removal stage, magnesium hydroxide [Mg(OH)₂] and other impurities are removed from the process stream through a reaction with hydrated lime. This reaction causes the impurities to precipitate, allowing them to be separated via filtration. The filtrate slurry then enters the evaporation circuit, where mechanical evaporators and evaporation ponds precipitate sodium chloride for removal. The concentrated brine, now enriched with calcium chloride (CaCl2), is either directed to truck loading for sale as a byproduct or sent to the Gypsum Circuit for further processing.

    • Gypsum Circuit: The Calcium Chloride rich brine reacts with sulfuric acid to precipitate gypsum, which is then filtered and refined to be sold as a byproduct. This circuit also facilitates the regeneration of hydrochloric acid, which is recycled back to the wellfield for reuse in the mining process.

    Infrastructure

    The Project is located near Interstate 40 along with nearby access to rail and a natural gas transmission line. Currently, the Project receives approximately 1 megawatt of shore power.

    Infrastructure required for the Project is expected to consist of:

    • Natural gas – the Project will require a natural gas pipeline that will need to be connected into a nearby transmission pipeline to serve the processing plant. Discussions are ongoing with a proposal received from the owner of the pipeline and the cost of piping from the Mojave Pipeline to a cogeneration facility (COGEN) included in the capital estimate.

    • Electrical power upgrade – an economic trade-off study is currently being conducted to evaluate co-generation versus an upgraded and dedicated powerline to the Project. The economic analysis in the Technical Report assumes the Project utility is COGEN.

    • Rail – a connection to a rail spur adjacent to the Project is included in the federal permit. Phase 1 logistics contemplate trucking finished product to the customers in the western United States and the Los Angeles ports. Byproducts are expected to be sold in the local California market. Tie-in to rail is expected to be considered for expansion phases of the Project.

    • Roads – Plant access roads will require upgrades, and some roads may require paving. New access roads are also being considered.

    • Water – 5E currently has adequate water resources for Phase 1 of the project with two existing water wells with millsite claims for each well.

    • Material storage – storage for materials products and consumables will need to be built with storage for boric acid and gypsum included in the capital estimate. A calcium chloride load-out station is also included in the capital estimate and is expected to be stored in tanker trucks ready for distribution.

    Environmental

    In 1990, a Plan of Operations was submitted to the United States Bureau of Land Management (“BLM”) and a Mining Conditional Use Permit and Reclamation Plan was submitted to San Bernardino County, which triggered environmental review under the National Environmental Policy Act (“NEPA”) and the California Environmental Quality Act (“CEQA”). The BLM and San Bernardino County prepared a joint Environmental Impact Statement (“EIS”) and Environmental Impact Report (“EIR”) to satisfy their environmental review requirements under NEPA and CEQA. In 1994, the EIS and EIR process resulted in the issuance of a Record of Decision from the BLM that approved the Plan of Operations and approval of the Mining Condition Use Permit and Reclamation Plan from San Bernardino County. The Project is permitted to produce 90,000 short tons per year of borates, defined as boron oxide or boron oxide equivalent, thus permitting up to approximately 160,000 short tons of boric acid.

    In 2020, a Class 3 Underground Injection Control (“UIC”) permit was issued by the United States Environmental Protection Agency (“EPA”). The EPA retains primacy for Class 3 solution mining UIC permits. In November 2023, the EPA approved the commencement of mining operations under this permit. These regulatory approvals form the foundation for Phase 1 development, which aligns with the previously authorized project scope.

    Capital Costs

    The Technical Report Summary for the Project has been successfully completed by Engineering, Procurement, and Construction Management company Fluor Corporation, Petroleum Engineering and Operating Services company Miocene, Inc., along with collaboration with Ad Infinitum, an engineering firm specializing in chemical process design. An AACE Class 4 estimate capital cost estimate (± 25%) has been prepared. The AACE Class 4 capital estimate covers the period from Front End Engineering Design engineering to first production and is reported in real dollars.

    Capital cost expectations for a 130,000 short ton per annum boric acid plant (inclusive of co-product processing and COGEN power) were determined to be $367M for the first stage plus a contingency of $55M and owner’s cost estimate of $13M for a total capital estimate of $435M. Table 4 outlines the capital cost estimate, including initial development costs and a conservative provision for sustaining capital, based on solution mining-specific assumptions, including periodic wellfield expansion, re-drilling, and maintenance costs over the life of mine.

    Table 4. Capital Cost Estimate

    Scope

    Capital Cost (USD Millions)

    Process Facility

    $280.7

    COGEN

    $50.2

    Wellfield

    $30.8

    Evaporation Ponds

    $5.6

    Sub-total

    $367.3

    Contingency

    $55.1

    Owner’s Cost

    $12.5

    Total Capital

    $434.9

    Operating Costs

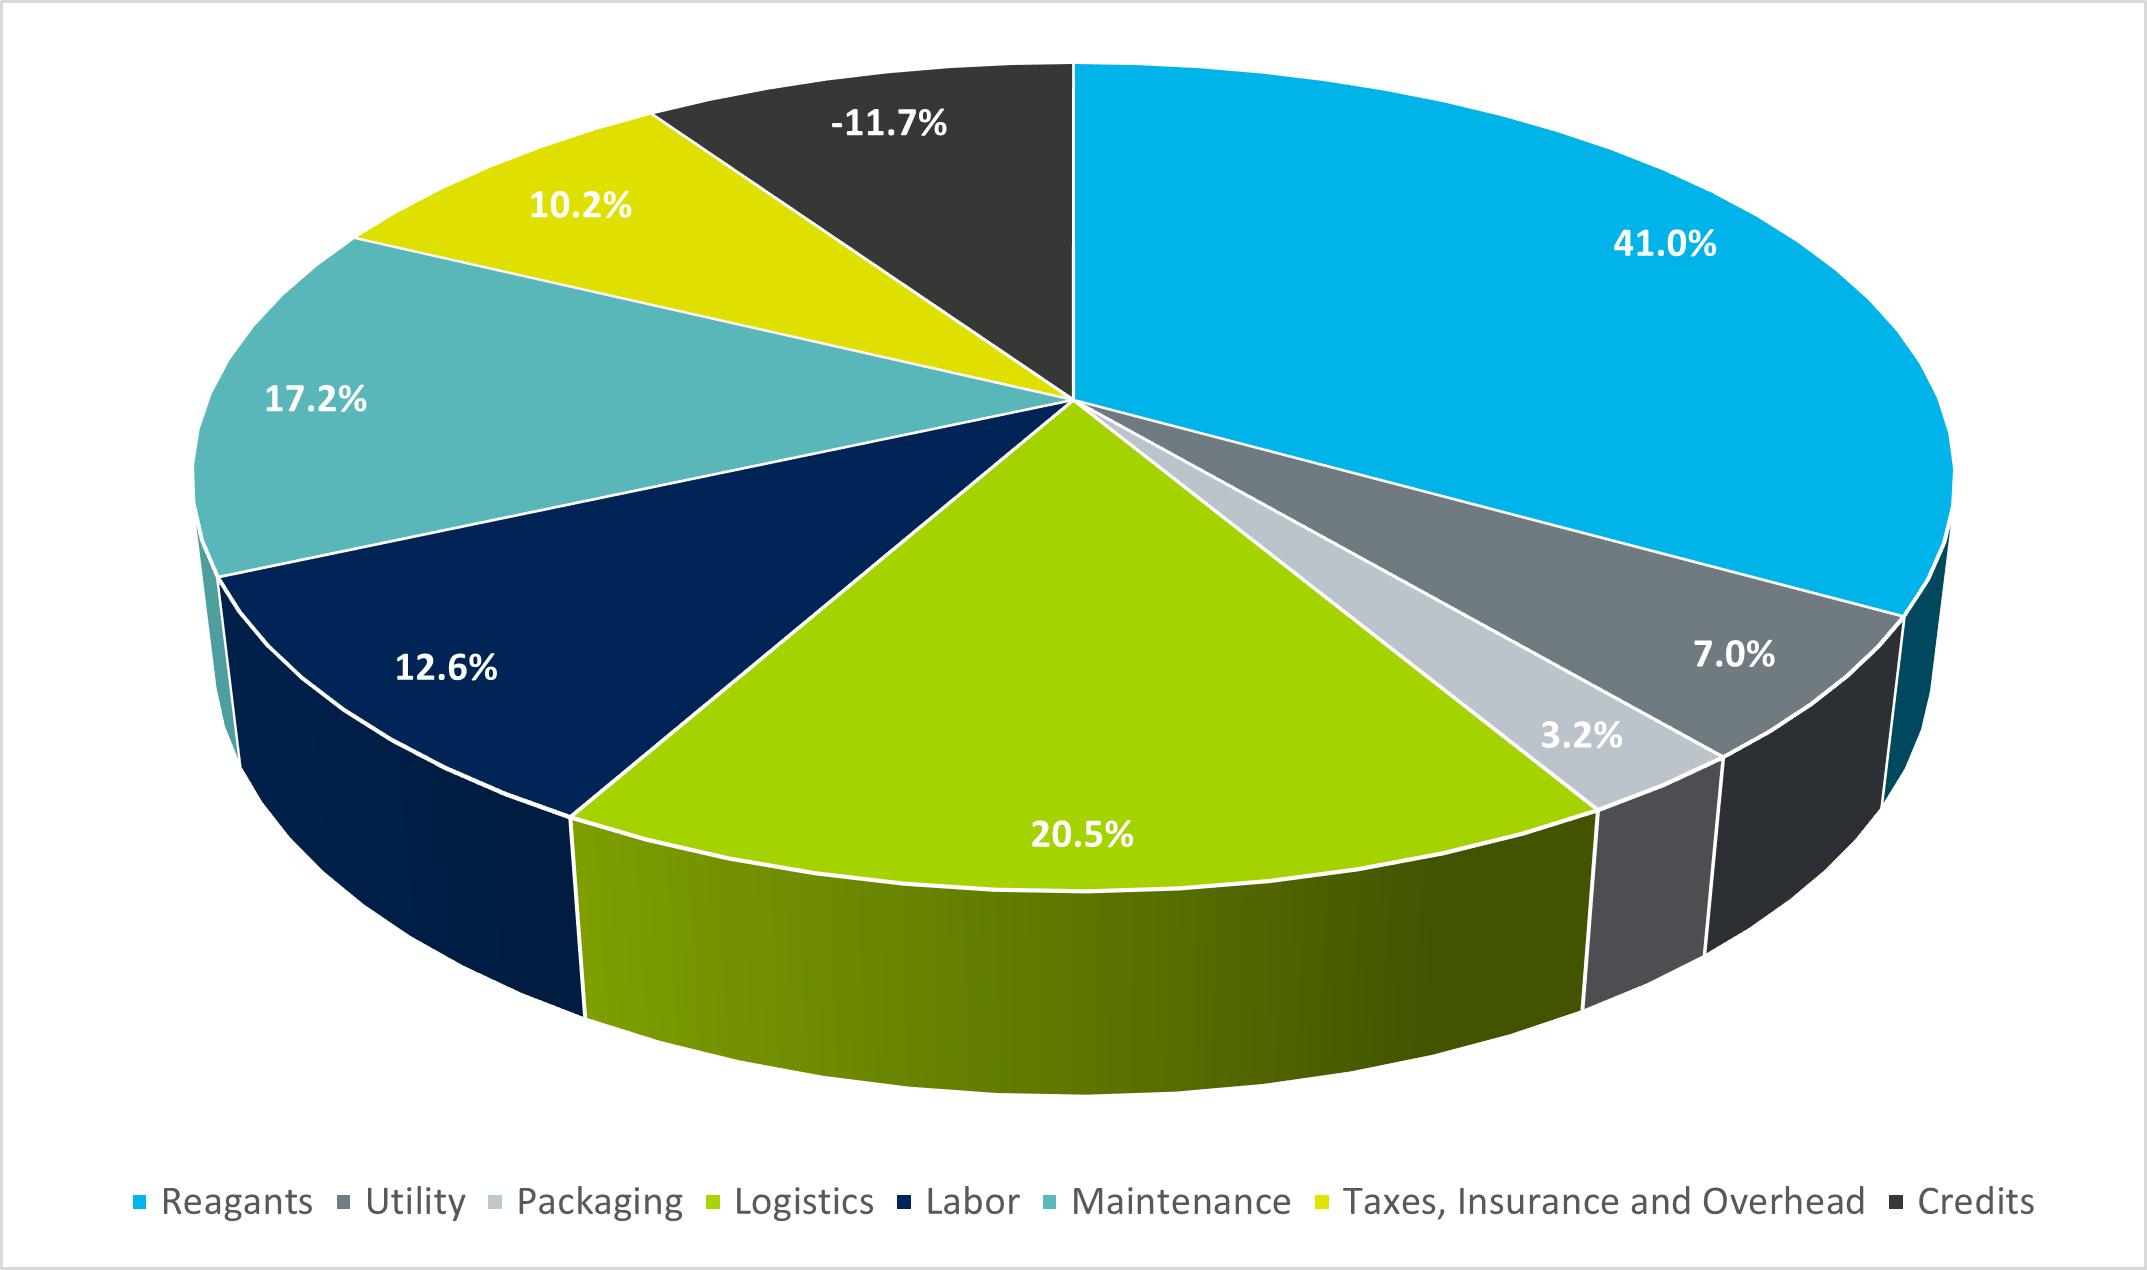
    Operating costs for the project are segregated into Variable, Fixed, and Other operating costs and are based on detailed material and energy balances provided by Fluor Corporation and a principles first labor build-up. Variable operating costs include packaging, logistics, and raw materials such as natural gas, hydrochloric acid, sulfuric acid, and lime. Fixed operating costs include administrative labor, operating labor, general and administrative overhead, repair labor, repair materials, as well as taxes and insurance. Other operating costs include disposal costs of metals impurities offset with byproduct credits from gypsum and calcium chloride. Table 5 summarizes the operating cost by production phase.

    Table 5. Operating Cost

    Operating Costs (Full-Run Rate)

    Variable Costs

    $/t H3BO3

    405.7

    Fixed Costs

    $/t H3BO3

    222.1

    Credits

    $/t H3BO3

    (73.0)

    Total Costs (inclusive of logistics)

    $/t H3BO3 (net)

    554.8

    Figure 4. Operating Cost Breakdown

    Economic Analysis

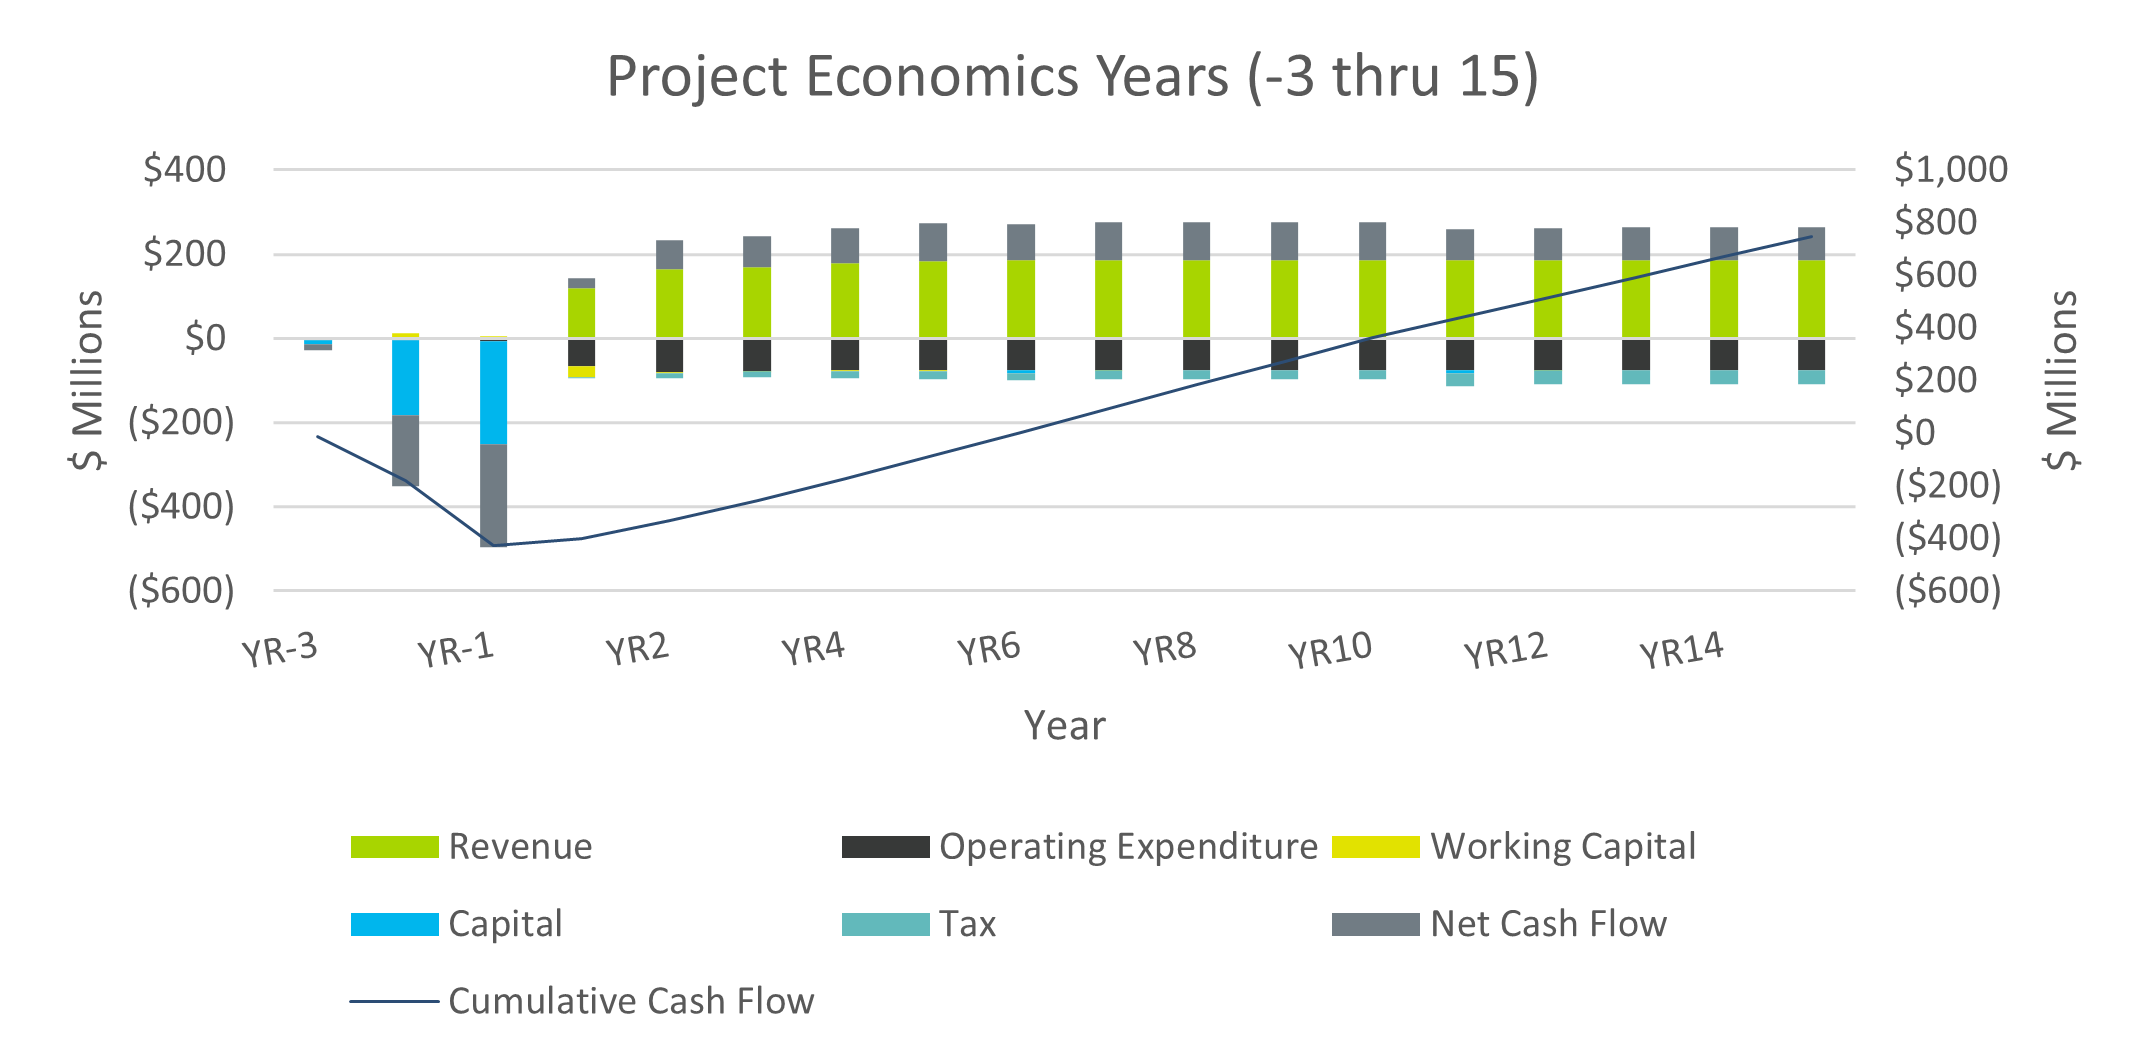
    The Project economics were evaluated using a discounted cashflow analysis based on annual cashflows for the life of the project. The financial model was prepared on an annual basis from the mineral reserve effective date to the exhaustion of mineral reserves for the current mining plan. Mine life can be extended and the Project has additional resources that can be converted to additional mineral reserves with expansion of the wellfield or mine plan in the future. The financial model results are presented in real U.S. dollars.

    As with the capital and operating forecasts, the economic analysis is inherently a forward-looking exercise. These estimates rely upon a range of assumptions and forecasts that are subject to change depending upon macroeconomic conditions, operating strategy and new data collected through operation of the SSF. Table 6 summarizes the economic results and Figure 5 highlights project cashflows during the first 15 years.

    Table 6. Economic Analysis Summary

    Description

    Units

    Total/Amount

    Average Price LOM – H3BO3

    $ / short ton

    1,355

    Netback Price – Gypsum

    $ / short ton

    21

    Netback Price – CaCl2

    $ / short ton

    120

    Pre-Tax: Free Cashflow

    $M USD

    3,749

    Pre-Tax: NPV7

    $M USD

    725

    Pre-Tax: IRR

    %

    19.2

    After-Tax: Free Cashflow

    $M USD

    2,625

    After-Tax: NPV7

    $M USD

    469

    After-Tax: IRR

    %

    15.9

    After-Tax: Payback Period

    years

    5.9

    Figure 5. Cashflow Profile by Year

    Financial Model Sensitivity

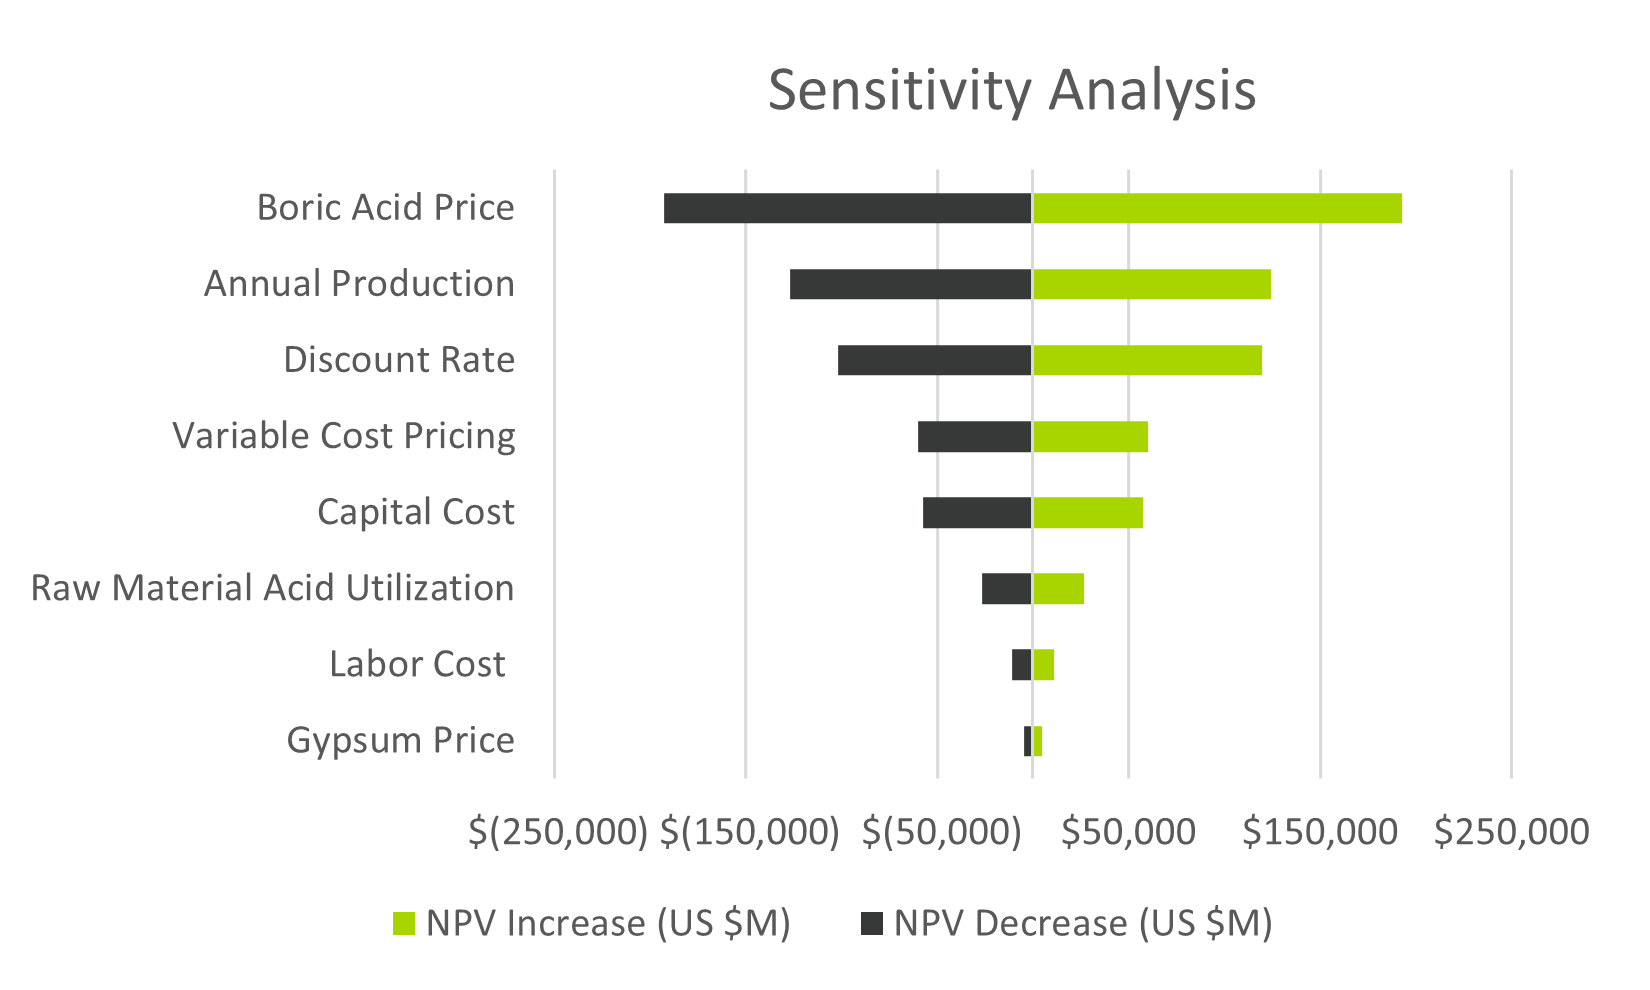
    Sensitivity analysis for the financial model was performed based on changes to boric acid price, annual production, discount rate, variable cost pricing, gypsum price, labor cost per person, and raw material acid utilization. Using a ±10% change for each variable, NPV7 is plotted in real dollars for comparison and arranged in order of total variability.

    Figure 6. Economic Sensitivity

    Qualified Persons

    The Technical Report, entitled “Preliminary Feasibility Report & Technical Report Summary, 5E Advanced Materials Fort Cady Project,” dated August 7, 2025, was prepared in accordance with the Securities and Exchange Commission S-K regulations, Title 17, Part 229, Items 601 and 1300 through 1305. The Technical Report was prepared by the following firms and persons: Miocene, Inc., Fluor Corporation, Geomega, Inc., Escalante Geological Services, LLC and Mr. Paul Weibel. With the exception of Mr. Weibel, who serves as the Company’s Chief Executive Officer, none of the qualified persons is affiliated with the Company or any other entity that has an ownership, royalty, or other interest in the property.

    The Technical Report will be available on the U.S. Securities and Exchange’s EDGAR website as an Exhibit 96.1 to the Current Report on Form 8-K filed by the Company on August 7, 2025, in connection with this news release. The Technical Report includes relevant information regarding the assumptions, parameters, and methods used for the Mineral Resource and Mineral Reserve estimates for the Fort Cady Project, as well as information regarding data verification, exploration procedures, and other matters relevant to the scientific and technical disclosure contained in this news release.

    Other disclosures of a scientific or technical nature included in this news release regarding the Fort Cady Project have been reviewed, verified, and approved by Mr. Paul Weibel, Chief Executive Officer of 5E Advanced Materials, Inc. who is a Qualified Person as defined by Regulation S-K, Subpart 1300 promulgated by the U.S. Securities and Exchange Commission. Mr. Weibel is responsible for reviewing information related to market strategy, product pricing, and economic assumptions.’

    The complete Technical Report titled “Preliminary Feasibility Report & Technical Report Summary, 5E Advanced Materials Fort Cady Project” is available on EDGAR as Exhibit 96.1 to the Company’s Current Report on Form 8-K filed on August 7, 2025. It is also available on the Company’s website – HERE.

    About 5E Advanced Materials, Inc.

    5E Advanced Materials, Inc. (Nasdaq: FEAM) (ASX:5EA) is focused on becoming a vertically integrated global leader and supplier of boron specialty and advanced materials, complemented by lithium co-product production. The Company’s mission is to become a supplier of these critical materials to industries addressing global decarbonization, food and domestic security. Boron and lithium products will target applications in the fields of electric transportation, clean energy infrastructure, such as solar and wind power, fertilizers, and domestic security. The business strategy and objectives are to develop capabilities ranging from upstream extraction and product sales of boric acid, lithium carbonate and potentially other co-products, to downstream boron advanced material processing and development. The business is based on our large domestic boron and lithium resource, which is located in Southern California and designated as Critical Infrastructure by the Department of Homeland Security’s Cybersecurity and Infrastructure Security Agency.

    Forward Looking Statements

    This press release includes “forward-looking statements” within the meaning of the Private Securities Litigation Reform Act of 1995, as amended. All statements other than statements of historical fact included in this press release should be considered forward looking statements, including without limitation statements regarding the Project’s capital and operating costs; cash costs to produce boron and its related byproducts, as well as estimated contingencies; projected future pricing for boric acid and its related byproducts; the forecasted net present value; projected production volumes and revenues; anticipated cash flows; anticipated cut-off grade and recovery rates; the proposed design of the commercial scale facility; the timing of large-scale commercial production; construction timelines; ability to maintain and modify permits; infrastructure needs; environmental impacts; potential to successfully finance the company and the proposed commercial scale facility; anticipated market value and demand for boric acid, calcium chloride and gypsum; potential technology solutions; anticipated use of land and water; potential for expansion of mineral resources; mineral resource and reserve estimates and assumptions; the potential for future phases of the Project; availability of energy to operate the facility; the economic potential of the Project; and our ability to produce boron and its related byproducts. When used in this press release, the words “believe,” “project,” “expect,” “anticipate,” “estimate,” “intend,” “budget,” “target,” “aim,” “strategy,” “plan,” “guidance,” “outlook,” “intent,” “may,” “should,” “could,” “will,” “would,” “will be,” “will continue,” “will likely result,” and similar expressions are intended to identify forward-looking statements, although not all forward-looking statements contain such identifying words. These forward-looking statements are based on the Company’s current expectations and assumptions about future events and are based on currently available information as to the outcome and timing of future events. We caution you that these forward-looking statements are subject to all of the risks and uncertainties, most of which are difficult to predict and many of which are beyond our control, incident to the extraction of the critical materials we intend to produce and advanced materials production and development. These risks include, but are not limited to: our ultimate ability to satisfy all customer qualification criteria and achieve commercial offtake agreements, our limited operating history in the borates and lithium industries and no revenue from our proposed extraction operations at our properties; our need for substantial additional financing to execute our business plan and our ability to access capital and the financial markets; our status as an exploration stage company dependent on a single project with no known Regulation S-K 1300 mineral reserves and the inherent uncertainty in estimates of mineral resources; our lack of history in mineral production and the significant risks associated with achieving our business strategies, including our downstream processing ambitions; our incurrence of significant net operating losses to date and plans to incur continued losses for the foreseeable future; risks and uncertainties relating to the development of the Fort Cady project, including our ability to timely and successfully complete our proposed Commercial Scale Boron Facility; our ability to obtain, maintain and renew required governmental permits for our development activities, including satisfying all mandated conditions to any such permits; the implementation of and expected benefits from certain reduced spending measures; the impact of changes in U.S. trade policies and the imposition of tariffs; and other risks and uncertainties set forth in our filings with the U.S. Securities and Exchange Commission from time to time. Should one or more of these risks or uncertainties occur, or should underlying assumptions prove incorrect, our actual results and plans could differ materially from those expressed in any forward-looking statements. No representation or warranty (express or implied) is made as to, and no reliance should be placed on any information, including projections, estimates, targets, and opinions contained herein, and no liability whatsoever is accepted as to any errors, omissions, or misstatements contained herein. You are cautioned not to place undue reliance on any forward-looking statements, which speak only as to the date of this press release.

    For additional information regarding these various factors, you should carefully review the risk factors, uncertainties and other disclosures in the Company’s Form 10-K filed on September 9, 2024, as updated by the Company’s Form 10-Q filed on May 15, 2025, and subsequent filings with the U.S. Securities and Exchange Commission throughout the year, as well as in its filings under the Australian Securities Exchange. Any forward-looking statements are given only as of the date hereof. Except as required by law, 5E expressly disclaims any obligation to update or revise any such forward-looking statements. Additionally, 5E undertakes no obligation to comment on third party analyses or statements regarding 5E’s actual or expected financial or operating results or its securities.

    For further information contact:

    Michael MacMillan or Paola Ashton
    PRA Communications
    team@pracommunications.com
    Ph: +1 (604) 681-1407

    SOURCE: 5E Advanced Materials, Inc.

    View the original press release on ACCESS Newswire

    The post 5E Advanced Materials Publishes Fort Cady Project SK-1300 Pre-Feasibility Technical Report with a US$724.8M Pre-Tax NPV7, 19.2% IRR, Initial 39.5-Year Mine Life appeared first on Local News Hub.

  • LHH Launches LHH Interview Center, with Yoodli Technology, to Ready Candidates for Real-Life Interview Experience

    LHH Launches LHH Interview Center, with Yoodli Technology, to Ready Candidates for Real-Life Interview Experience

    The LHH Interview Center builds interview and networking confidence while supporting self-guided learning and AI skill development for today’s evolving job market.

    NEW YORK, NY / ACCESS Newswire / August 7, 2025 / LHH, the integrated professional talent solutions provider and global business unit of the Adecco Group, today announces its global roll out of the new LHH Interview Center that is a part of the LHH Career Studio.

    Designed for people navigating career transitions worldwide, the LHH Career Studio is a digital platform that leverages 50 years of industry expertise, behavioral science and advanced research to deliver a dynamic suite of career solutions. With AI-driven features, real-time job market data and professional coaching, the LHH Career Studio supports over 500,000 candidates and thousands of organizations annually, across over 60 countries worldwide.

    The LHH Interview Center helps candidates master interview skills through realistic simulations, smart responses and live feedback. Its private, customizable experience builds soft skills on demand, enabling job seekers navigating career changes to feel prepared and in control of their next step.

    In the LHH Interview Center, an AI interviewer engages users in practical roleplay by asking contextual questions, responding dynamically and providing actionable commentary on delivery, content and communication style. This platform supports multiple interview formats where users can customize their practice to tailored questions based on job descriptions, to ensure preparation is both relevant and effective.

    “At LHH, we are committed to providing the most innovative candidate experience in the market, with human need at the top of mind,” says John Morgan, President of LHH’s Career Transition & Mobility, Leadership Development & Coaching and HR & Talent Advisory. “Technology can scale career transition support, but empathy is at the core of any transition work. In today’s shifting job market, we are evolving our tools to meet the needs of candidates facing unpredictable career transitions. The LHH Career Studio is intentionally designed so candidates can be successful, and the LHH Interview Center equips job seekers to build self-awareness and trust in their skills, helping them find better-fit opportunities faster.”

    Launched in the United States earlier this year and now expanding globally, the tool has seen strong adoption and enthusiasm. Many users return for multiple sessions, with some completing more than 300 practice sessions.

    Recognizing that even the most advanced algorithms cannot replace genuine human support, LHH Career Transition coaches and talent leaders help candidates interpret the data and skills identified by the tool. The AI-garnered insights allow coaches to focus more deeply on relationship building, guiding candidates through the emotional challenges of career transition.

    “The combination of Yoodli’s cutting-edge technology with LHH’s career transition expertise has resulted in a thoughtful, pioneering and content-rich solution,” says Varun Puri, CEO and Co-Founder of Yoodli. “Candidates describe it as an immersive simulation experience, especially valuable for those who have not interviewed in years, are changing career paths or have limited opportunities and cannot afford to fail. It is also a confidence booster for those anxious about what might come up in a real interview.”

    The LHH Interview Center is now available on Career Studio in the U.S. and is being rolled out for all LHH Career Transition candidates globally in September this year.

    For organizations looking to empower transitioning talent, learn more about how to inspire career transformation with the LHH Career Studio.

    ###

    About LHH
    LHH empowers professionals and organizations to achieve bold ambitions and secure lasting impact through unique advisory services and professional talent solutions.

    LHH’s full suite of offerings connects solutions that are traditionally siloed, making LHH a single talent partner for organizations. In a rapidly evolving landscape with complex challenges, we create value across the entire professional talent journey. From hiring great people, developing skills and nurturing leaders, to advancing individuals to the next stage of their careers, LHH makes talent a competitive edge.

    We believe the future of work lies at the intersection of exceptional human care and innovation. Powered by science, technology, and proprietary data analytics, LHH’s approach is crafted to align with business strategies and cultures, delivering powerful, sustainable, and measurable impact.

    LHH has a team of over 12,000 professionals, across 60+ countries and more than 50 years of experience. As part of the Adecco Group, we bring together global excellence, local knowledge and centralized coordination for thousands of companies and millions of people worldwide.

    Recruitment. Development. Career Transition.
    LHH. A beautiful working world.

    To learn more about LHH, visit: lhh.com.

    About Yoodli
    Yoodli is the market leader in AI-powered communication coaching. Trusted by Fortune 500 companies, business schools, and coaching organizations, Yoodli helps individuals improve sales pitches, public speaking, interviewing, and persuasive communication through interactive roleplay and data-driven feedback. Its AI technology enables scalable and personalized practice for every professional.

    Media Contacts
    LHH Global External Communications
    PR@lhh.com

    Yoodli Press
    press@yoodli.ai

    SOURCE: LHH

    View the original press release on ACCESS Newswire

    The post LHH Launches LHH Interview Center, with Yoodli Technology, to Ready Candidates for Real-Life Interview Experience appeared first on Local News Hub.

  • Main Graphics Expands Large Format Printing Capabilities to Better Serve Orange County and Surrounding Areas

    Main Graphics Expands Large Format Printing Capabilities to Better Serve Orange County and Surrounding Areas

    Main Graphics, a leading commercial print provider based in Irvine, California, is proud to announce the significant expansion of its large format printing services. The company has increased its production capacity and upgraded its equipment to better serve a growing client base across Orange County and surrounding areas. This development positions Main Graphics as one of the region’s go-to providers for high-quality large format printing, including banners, posters, event signage, point-of-purchase displays, and more.

    Known for its customer-first approach and fast turnaround times, Main Graphics has been a trusted partner for local businesses for over two decades. As demand for large format printing continues to rise across industries such as retail, real estate, construction, education, and event management, the company has made strategic investments to ensure it can deliver top-tier visual materials at scale—without compromising the quality or consistency that clients have come to expect.

    The expansion includes the addition of high-performance large format printing equipment that supports a wide range of media types, finishes, and display formats. This not only enables faster job completion but also opens the door to a broader variety of custom print solutions. Businesses throughout Irvine, Anaheim, Santa Ana, Huntington Beach, Costa Mesa, Tustin, and beyond will now benefit from an even more robust offering tailored to their signage and marketing needs.

    “Today’s businesses are looking for ways to stand out in crowded, competitive environments,” said a company representative. “Whether it’s a retail store needing vibrant window graphics, a real estate agent requiring durable outdoor signage, or a corporate team preparing for a major event, high-quality large format printing plays a vital role in visibility and branding. We’ve expanded our capabilities to meet that demand head-on and give local businesses a clear edge in the marketplace.”

    As part of this service expansion, Main Graphics is offering a comprehensive suite of large format print products that cover a wide range of business needs. These include indoor and outdoor banners, vinyl and mesh signage, wall and floor graphics, posters, foam core and PVC boards, trade show displays, pop-up signage, and vehicle decals. From simple promotional posters to complex event packages, Main Graphics provides expert support throughout the process—from design consultation and material selection to finishing, packaging, and local delivery.

    The company also understands that turnaround time is often critical for large format jobs, especially for events and time-sensitive promotions. Thanks to the upgraded workflow, Main Graphics can now complete many large format jobs in significantly less time, offering same-day or next-day turnaround on select products without sacrificing precision or durability.

    “Our clients count on us to be reliable partners,” the representative added. “By upgrading our large format operations, we’re not just increasing our output—we’re also enhancing the flexibility, speed, and attention to detail we bring to every project. That’s what sets us apart.”

    Another key component of the expansion is Main Graphics’ commitment to sustainability. The company uses eco-friendly inks and recyclable materials whenever possible, helping clients meet their own environmental goals while still producing standout visual materials. This approach aligns with the values of many modern organizations that prioritize sustainable practices in their supply chain and vendor relationships.

    Main Graphics has also made it easier for businesses to collaborate on large format print projects. The company’s dedicated team of print specialists works closely with each client to ensure color accuracy, material suitability, and proper file preparation. Whether a client is printing one large banner or hundreds of event signs, the process is streamlined, communicative, and focused on delivering exactly what’s needed.

    With this service enhancement, Main Graphics is better equipped than ever to support businesses throughout Orange County with professional, cost-effective large format printing. The expansion reflects the company’s continued growth and its commitment to investing in solutions that make an impact—both for clients and the communities they serve.

    “In a visually driven world, print is more important than ever,” the representative concluded. “We’re excited to bring more capabilities, more speed, and more creative solutions to the businesses that rely on us.”

    The post Main Graphics Expands Large Format Printing Capabilities to Better Serve Orange County and Surrounding Areas appeared first on Local News Hub.

  • BGSF, Inc. Reports Second Quarter 2025 Financial Results

    BGSF, Inc. Reports Second Quarter 2025 Financial Results

    PLANO, TX / ACCESS Newswire / August 6, 2025 / BGSF, Inc. (NYSE:BGSF), a leading provider of workforce solutions through the Property Management segment, today reported financial results for the second fiscal quarter ended June 29, 2025.

    Q2 2025 Highlights from Continuing Operations (results include sequential comparisons to Q1 2025):

    • Revenues were $23.5 million for Q2, compared to $20.9 million for Q1 . The 12.6% increase from Q1 is primarily driven by increased billed hours from seasonal demand.

    • Gross profit was $8.4 million for Q2, up from $7.6 million in Q1, primarily due to higher sales.

    • Net loss was $4.9 million, or $0.44 per diluted share for Q2, compared to a net loss of $2.2 million in Q1 or $0.21 per diluted share.

    • Adjusted EBITDA1 loss was $1.1 million (4.9% of revenues) in Q2 compared to $1.0 million (5.4% of revenues) in Q1.

    • Adjusted EPS1 loss was $0.19 for Q2, compared with Adjusted EPS1 loss of $0.11 for Q1.

    SUMMARY OF FINANCIAL RESULTS FROM CONTINUING OPERATIONS
    (dollars in thousands) (unaudited)

    For the Thirteen Week Periods Ended

    June 29,
    2025

    June 30,
    2024

    March 30,
    2025

    Revenues

    $

    23,506

    $

    25,726

    $

    20,883

    Gross profit

    $

    8,410

    $

    9,596

    $

    7,560

    Gross profit percentage

    35.8

    %

    37.3

    %

    36.2

    %

    Operating loss

    $

    (4,425

    )

    $

    (1,475

    )

    $

    (1,773

    )

    Net loss

    $

    (4,862

    )

    $

    (2,082

    )

    $

    (2,245

    )

    Net loss per diluted share

    $

    (0.44

    )

    $

    (0.19

    )

    $

    (0.21

    )

    Non-GAAP Financial Measures:
    Adjusted EBITDA1

    $

    (1,145

    )

    $

    (264

    )

    $

    (1,032

    )

    Adjusted EBITDA Margin (% of revenue)1

    (4.9)

    %

    (1.0)

    %

    (5.4)

    %

    Adjusted EPS1

    $

    (0.19

    )

    $

    (0.04

    )

    $

    (0.11

    )

    1 Adjusted EBITDA and Adjusted EPS are non-GAAP financial measures as defined and reconciled below.

    Interim Co-Chief Executive Officer, Chief Financial Officer and Secretary, Keith Schroeder, said, “The proposed sale of BGSF’s Professional division to INSPYR is moving along as planned, a proxy statement was filed on July 25th to call for a special meeting of shareholders on September 4th to vote on the transaction. Following the closing of the transaction, we will perform under a Transition Service Agreement, or TSA, for up to six months or longer to help INSPYR stand up the business in their operating environment. We will be paid for those services, and we also plan to continue reducing our overhead costs to align with a smaller, Property Management-focused company. We expect our financial results, post-close, to be noisy for a couple of quarters.”

    Interim Co-Chief Executive Officer and Property Management President, Kelly Brown, commented, “Our second quarter Sales from continuing operations, or the Property Management business, of $23.5 million, improved sequentially on seasonality from the first quarter by 12.6%, and declined from last year’s quarter of 8.6%. Gross margins were relatively stable at 35.8% for the second quarter. In addition to implementing cost reduction measures that Keith addressed, we are also re-baselining Property Management costs to align more closely with revenue and investing in strategic initiatives to drive revenue and profitability in our business. Specifically, we are implementing AI-powered sales and recruiting tools that are expected to be operational by the middle of the fourth quarter.”

    Conference Call

    BGSF will discuss its second quarter 2025 financial results during a conference call and webcast at 9:00 a.m. ET on August 7, 2025. Interested participants may dial 1-888-506-0062 (Toll Free) or 1-973-528-0011 (International). A replay of the call will be available until August 21, 2025. To access the replay, please dial 1-877-481-4010 (Toll Free), or 1-919-882-2331 (International) and enter access code 52558. The live webcast and archived replay are accessible from the investor relations section of the Company’s website at https://investor.bgsf.com/events-and-presentations/default.aspx

    About BGSF

    BGSF provides consulting, managed services and professional workforce solutions to a variety of industries through its various divisions in IT, Finance & Accounting, Managed Solutions, and Property Management. BGSF has integrated several regional and national brands achieving scalable growth. The Company was ranked by Staffing Industry Analysts as the 97th largest U.S. staffing company and the 49th largest IT staffing firm in 2024. The Company’s disciplined acquisition philosophy, which builds value through both financial growth and the retention of unique and dedicated talent within BGSF’s family of companies, has resulted in a seasoned management team with strong tenure and the ability to offer exceptional service to our field talent and client partners while building value for investors. For more information on the Company and its services, please visit its website at www.bgsf.com.

    Previously Announced Equity Purchase Agreement

    On June 16, 2025, BGSF announced that it had signed a definitive agreement to sell its Professional Division to INSPYR Solutions (“INSPYR”). The proposed transaction is subject to the satisfaction of customary closing conditions, including but not limited to the approval of BGSF’s stockholders. For additional information associated with the transaction, please see BGSF’s filings from time to time with the Securities and Exchange Commission.

    Forward-Looking Statements

    This press release contains forward-looking statements within the meaning of U.S. federal securities laws. Such forward-looking statements include, but are not limited to, statements regarding the proposed transaction, obtaining customary shareholder approval, satisfying closing conditions, the closing, including its timing, of the sale of BGSF, Inc.’s Professional Division, the use of proceeds of the sale, the projected operational and financial performance of BGSF and its various subsidiaries, including following the sale of BGSF’s Professional Division, its offerings of services and solutions and developments and reception of its services and solutions by client partners, and BGSF’s expectations, hopes, beliefs, intentions, plans, prospects, or strategies regarding the future revenue and the business plans of BGSF’s management team. Any statements contained herein that are not statements of historical fact may be deemed to be forward-looking statements. In addition, any statements that refer to projections, forecasts, or other characterizations of future events or circumstances, including any underlying assumptions, are forward-looking statements. The words “anticipate,” “believe,” “continue,” “could,” “endeavor,” “estimate,” “expect,” “intends,” “may,” “might,” “plan,” “possible,” “potential,” “predict,” “project,” “should,” “will,” “would,” and similar expressions may identify forward-looking statements, but the absence of these words does not mean that a statement is not forward-looking. The forward-looking statements contained in this press release are based on certain assumptions and analyses made by the management of BGSF considering their respective experience and perception of historical trends, current conditions, and expected future developments and their potential effects on BGSF as well as other factors they believe are appropriate in the circumstances. There can be no assurance that future developments affecting BGSF will be those anticipated. These forward-looking statements involve a number of risks, uncertainties (some of which are beyond the control of the parties), or other assumptions that may cause actual results or performance to be materially different from those expressed or implied by these forward-looking statements, including the closing conditions for the sale of BGSF’s Professional Division not being satisfied, the ability of the parties to close the transaction on the expected closing timeline or at all, the nature, cost, or outcome of any legal proceedings relating to the transaction, the impact of the contemplated transaction on our stock price, the ability of BGSF to service or otherwise pay its debt obligations, including in the event the closing does not occur, the mix of services or solutions utilized by BGSF’s client partners and such client partners’ needs for these services or solutions, market acceptance of new offerings of services or solutions, the ability of BGSF to expand what it does for existing client partners as well as to add new client partners, whether BGSF will have sufficient capital to operate as anticipated, the impact the transaction or its announcement may have on BGSF’s operations, team members, field talent, client partners, and other constituents, the demand for BGSF’s services and solutions, economic activity in BGSF’s industry and in general, and certain risks, uncertainties, and assumptions described in BGSF’s most recently filed Annual Report on Form 10-K and subsequently filed Quarterly Reports on Form 10-Q under the heading “Risk Factors.” Should one or more of these risks or uncertainties materialize or should any of the assumptions being made prove incorrect, actual results may vary in material respects from those projected in these forward-looking statements. BGSF undertakes no obligation to update or revise any forward-looking statements, whether because of new information, future events, or otherwise, except as may be required under applicable securities laws.

    Additional Information About the Equity Purchase Agreement and Where to Find It

    In connection with the proposed transaction, BGSF filed with the Securities and Exchange Commission (the “SEC”) on July 25, 2025 a definitive proxy statement and other relevant documents, and mailed to BGSF’s shareholders a definitive proxy statement and other relevant documents on or about August 5, 2025. BEFORE MAKING ANY VOTING DECISION, BGSF’S SHAREHOLDERS ARE URGED TO READ THE DEFINITIVE PROXY STATEMENT IN ITS ENTIRETY AND ANY OTHER DOCUMENTS FILED WITH THE SEC IN CONNECTION WITH THE PROPOSED TRANSACTION OR INCORPORATED BY REFERENCE IN THE DEFINITIVE PROXY STATEMENT BECAUSE THEY CONTAIN IMPORTANT INFORMATION ABOUT THE PROPOSED TRANSACTION AND THE PARTIES TO THE PROPOSED TRANSACTION. Investors and shareholders may obtain a free copy of documents filed by BGSF with the SEC at the SEC’s website at www.sec.gov. In addition, investors and shareholders may obtain a free copy of BGSF’s filings with the SEC from BGSF’s website at https://investor.bgsf.com/financials/sec-filings/default.aspx, or by sending a written request to BGSF’s Corporate Secretary at our principal executive offices at 5850 Granite Parkway, Suite 730, Plano, Texas 75024.

    Participants in the Solicitation

    This communication is not a solicitation of proxies in connection with the proposed transaction. BGSF, its directors, and certain of its executive officers and employees may be deemed to be participants in soliciting proxies from its shareholders in connection with the proposed transaction. Information regarding BGSF’s directors and executive officers is contained in the most recent Annual Report on Form 10-K filed with the SEC. More detailed information regarding the identity of potential participants in the solicitation of BGSF’s shareholders in connection with the proposed transaction, and their direct or indirect interests, by securities, holdings, or otherwise, is set forth in the definitive proxy statement and other materials relating to the proposed transaction filed with the SEC. You may obtain free copies of these documents using the sources indicated above in Additional Information and Where to Find It.

    CONTACT:

    Steven Hooser or Sandy Martin
    Three Part Advisors
    ir@BGSF.com 214.872.2710 or 214.616.2207

    CONSOLIDATED BALANCE SHEETS
    (in thousands, except share amounts)

    2025

    2024

    (unaudited)

    (audited)

    ASSETS
    Current assets
    Cash and cash equivalents

    $

    2,777

    $

    32

    Accounts receivable (net of allowance for credit losses of $1,156 and $910, respectively)

    13,637

    17,148

    Prepaid expenses

    1,687

    1,600

    Other current assets

    2,029

    2,213

    Current assets of discontinued operations

    27,473

    24,354

    Total current assets

    47,603

    45,347

    Property and equipment, net

    299

    608

    Other assets
    Deposits

    1,996

    2,003

    Software as a service, net

    3,651

    4,068

    Deferred income taxes, net

    9,227

    7,849

    Right-of-use asset – operating leases, net

    856

    1,083

    Intangible assets, net

    3,911

    4,385

    Goodwill

    1,074

    1,074

    Noncurrent assets of discontinued operations

    81,075

    83,694

    Total other assets

    101,790

    104,156

    Total assets

    $

    149,692

    $

    150,111

    LIABILITIES AND STOCKHOLDERS’ EQUITY
    Current liabilities
    Accounts payable

    $

    1,368

    $

    80

    Accrued payroll and expenses

    7,086

    4,868

    Long-term debt, current portion (net of debt issuance costs of $18 and $24, respectively)

    3,807

    3,801

    Accrued interest

    510

    223

    Income taxes payable

    295

    212

    Convertible note

    4,368

    4,368

    Lease liabilities, current portion

    474

    544

    Current liabilities of discontinued operations

    11,093

    11,825

    Total current liabilities

    29,001

    25,921

    Line of credit (net of debt issuance costs of $256 and $770, respectively)

    7,744

    5,625

    Long-term debt, less current portion (net of debt issuance costs of $149 and $198, respectively)

    30,664

    32,527

    Lease liabilities, less current portion

    506

    698

    Noncurrent liabilities of discontinued operations

    3,491

    3,071

    Total liabilities

    71,406

    67,842

    Commitments and contingencies
    Preferred stock, $0.01 par value per share, 500,000 shares authorized, -0- shares issued and outstanding

    Common stock, $0.01 par value per share; 19,500,000 shares authorized 11,158,828 and 11,038,623 shares issued and outstanding, respectively, net of 3,930 shares of treasury stock, at cost, respectively.

    55

    53

    Additional paid in capital

    70,733

    70,260

    Retained earnings

    7,498

    11,956

    Total stockholders’ equity

    78,286

    82,269

    Total liabilities and stockholders’ equity

    $

    149,692

    $

    150,111

    UNAUDITED CONSOLIDATED STATEMENTS OF OPERATIONS
    (in thousands, except per share and dividend amounts)

    For the Thirteen and Twenty-six Week Periods Ended June 29, 2025 and June 30, 2024

    Thirteen Weeks Ended

    Twenty-six Weeks Ended

    2025

    2024

    2025

    2024

    Revenues

    $

    23,506

    $

    25,726

    $

    44,389

    $

    50,273

    Cost of services

    15,096

    16,130

    28,419

    31,334

    Gross profit

    8,410

    9,596

    15,970

    18,939

    Selling, general, and administrative expenses

    12,576

    10,739

    21,580

    21,001

    Depreciation and amortization

    259

    332

    588

    671

    Operating loss

    (4,425

    )

    (1,475

    )

    (6,198

    )

    (2,733

    )

    Interest expense, net

    (1,829

    )

    (1,105

    )

    (2,931

    )

    (2,386

    )

    Loss from continuing operations before income taxes

    (6,254

    )

    (2,580

    )

    (9,129

    )

    (5,119

    )

    Income tax benefit from continuing operations

    1,392

    498

    2,031

    989

    Net loss from continuing operations

    (4,862

    )

    (2,082

    )

    (7,098

    )

    (4,130

    )

    Income from discontinued operations:
    Income from discontinued operations

    1,309

    1,601

    3,377

    3,319

    Income tax expense

    (183

    )

    (280

    )

    (737

    )

    (742

    )

    Net loss

    $

    (3,736

    )

    $

    (761

    )

    $

    (4,458

    )

    $

    (1,553

    )

    Net (loss) income per share – basic:
    Net loss from continuing operations

    $

    (0.44

    )

    $

    (0.19

    )

    $

    (0.65

    )

    $

    (0.38

    )

    Net income from discontinued operations:
    Income

    0.12

    0.15

    0.31

    0.31

    Income tax expense

    (0.02

    )

    (0.03

    )

    (0.07

    )

    (0.07

    )

    Net loss per share – basic

    $

    (0.34

    )

    $

    (0.07

    )

    $

    (0.41

    )

    $

    (0.14

    )

    Net (loss) income per share-diluted:
    Net loss from continuing operations

    $

    (0.44

    )

    $

    (0.19

    )

    $

    (0.65

    )

    $

    (0.38

    )

    Net income from discontinued operations:
    Income

    0.12

    0.15

    0.31

    0.31

    Income tax expense

    (0.02

    )

    (0.03

    )

    (0.07

    )

    (0.07

    )

    Net loss per share – diluted

    $

    (0.34

    )

    $

    (0.07

    )

    $

    (0.41

    )

    $

    (0.14

    )

    Weighted-average shares outstanding:
    Basic

    11,019

    10,880

    10,986

    10,858

    Diluted

    11,019

    10,880

    10,986

    10,858

    Cash dividends declared per common share

    $

    $

    $

    $

    0.15

    PROPERTY MANAGEMENT SEGMENT
    (dollars in thousands)

    Thirteen Weeks Ended

    Twenty-six Weeks Ended

    June 29,
    2025

    June 30,
    2024

    June 29,
    2025

    June 30,
    2024

    Contract field talent

    $

    23,000

    $

    25,272

    $

    43,279

    $

    49,332

    Contingent placements

    506

    454

    1,110

    941

    Revenue

    23,506

    25,726

    44,389

    50,273

    Compensation and related

    15,058

    16,090

    28,344

    31,254

    Other

    38

    40

    75

    80

    Gross profit

    8,410

    9,596

    15,970

    18,939

    Selling:
    Compensation

    4,195

    4,771

    8,121

    9,321

    Advertising, occupancy, and travel

    447

    564

    825

    908

    Software, insurance, and professional fees

    296

    336

    669

    632

    Other

    1,806

    674

    2,176

    1,374

    Contributions to overhead

    1,666

    3,251

    4,179

    6,704

    General and administrative:
    Compensation

    2,184

    2,365

    4,245

    4,678

    Software

    828

    590

    1,525

    1,226

    Professional fees

    569

    482

    1,111

    932

    Strategic alternatives review

    1,613

    280

    1,634

    349

    Other

    638

    677

    1,273

    1,580

    Depreciation and amortization

    259

    332

    588

    671

    Operating loss

    (4,425

    )

    (1,475

    )

    (6,197

    )

    (2,732

    )

    Interest expense, net

    (1,829

    )

    (1,105

    )

    (2,931

    )

    (2,386

    )

    Income tax benefit from continuing operations

    1,392

    498

    2,031

    989

    Net loss from continuing operations

    $

    (4,862

    )

    $

    (2,082

    )

    $

    (7,097

    )

    $

    (4,129

    )

    Capital expenditures

    $

    13

    $

    432

    $

    13

    $

    863

    Total assets

    $

    41,881

    $

    50,240

    $

    41,881

    $

    50,240

    UNAUDITED CONSOLIDATED STATEMENTS OF CASH FLOWS
    (in thousands)

    For the Twenty-six Week Periods Ended June 29, 2025 and June 30, 2024

    2025

    2024

    Cash flows from operating activities
    Net loss

    $

    (4,458

    )

    $

    (1,553

    )

    Net income from discontinued operations

    (2,640

    )

    (2,577

    )

    Adjustments to reconcile net loss to net cash provided by activities:
    Depreciation

    58

    83

    Amortization

    530

    588

    Software as a service

    425

    328

    Loss on disposal of property and equipment

    6

    Amortization of debt issuance costs

    598

    89

    Provision for credit losses

    1,656

    1,016

    Share-based compensation

    305

    439

    Deferred income taxes, net of acquired deferred tax liability

    (1,378

    )

    1,436

    Net changes in operating assets and liabilities:
    Accounts receivable

    1,851

    5,948

    Prepaid expenses

    (87

    )

    616

    Other current assets

    (393

    )

    820

    Deposits

    8

    593

    Accounts payable

    1,288

    160

    Accrued payroll and expenses

    3,263

    (867

    )

    Accrued interest

    287

    (218

    )

    Income taxes receivable

    (384

    )

    (771

    )

    Other current liabilities

    2,116

    Operating leases

    (33

    )

    (33

    )

    Net cash provided by continuing operating activities

    2,962

    14,585

    Net cash provided by discontinued operating activities

    253

    132

    Net cash provided by operating activities

    3,215

    14,717

    Cash flows from investing activities
    Capital expenditures

    (13

    )

    (863

    )

    Net cash used in continuing investing activities

    (13

    )

    (863

    )

    Net cash used in discontinued investing activities

    (63

    )

    (132

    )

    Net cash used in investing activities

    (76

    )

    (995

    )

    Cash flows from financing activities
    Net borrowings (payments) under line of credit

    1,604

    (10,808

    )

    Principal payments on long-term debt

    (1,913

    )

    (850

    )

    Payments of dividends

    (1,639

    )

    Issuance of ESPP shares

    134

    244

    Issuance of shares under the 2013 Long-Term Incentive Plan

    102

    Payments of debt issuance costs

    (29

    )

    (545

    )

    Net cash used in continuing financing activities

    (204

    )

    (13,496

    )

    Net change in cash and cash equivalents of continuing operations

    2,745

    226

    Cash and cash equivalents, beginning of period

    32

    Cash and cash equivalents, end of period

    $

    2,777

    $

    226

    Supplemental cash flow information:
    Cash paid for interest, net

    $

    1,950

    $

    2,417

    Cash paid for taxes, net of refunds

    $

    739

    $

    636

    NON-GAAP FINANCIAL MEASURES

    The financial results of BGSF, Inc. are prepared in conformity with accounting principles generally accepted in the United States of America (“GAAP”) and the rules of the U.S. Securities and Exchange Commission. To help the readers understand our financial performance, we supplements our GAAP financial results with Adjusted EBITDA and Adjusted EPS.

    A non-GAAP financial measure is a numerical measure of a company’s financial performance that excludes or includes amounts so as to be different than the most directly comparable measure calculated and presented in accordance with GAAP in the statement of income, balance sheet or statement of cash flows of a company. Adjusted EBITDA and Adjusted EPS are not measurements of financial performance under GAAP and should not be considered as alternatives to net income, net income per diluted share, operating income, or any other performance measure derived in accordance with GAAP, or as alternatives to cash flow from operating activities or measures of our liquidity. We believe that Adjusted EBITDA and Adjusted EPS are useful performance measures and are used by us to facilitate a comparison of our operating performance on a consistent basis from period-to-period and to provide for a more complete understanding of factors and trends affecting our business than measures under GAAP can provide alone. In addition, the financial covenants in our credit agreement are based on EBITDA as defined in the credit agreement.

    We define “Adjusted EBITDA” as earnings before interest expense, income taxes, depreciation and amortization expense, costs associated with the evaluation of potential strategic alternatives (“strategic alternatives review”), software as a service costs, and certain non-cash expenses such as share-based compensation expense, as well as certain specific events that management does not consider in assessing our on-going operating performance.

    We define “Adjusted EPS” as diluted earnings per share eliminating amortization expense of intangible assets from acquisitions, the strategic alternatives review, software as a service costs, and certain non-cash expenses such as share-based compensation expense, as well as certain specific events that management does not consider in assessing our on-going operating performance, net of the respective income tax effect.


    Reconciliation of Net Loss to Adjusted EBITDA
    (dollars in thousands)

    Thirteen Weeks Ended

    Twenty-six Weeks Ended

    Thirteen Weeks Ended

    June 29,
    2025

    June 30,
    2024

    June 29,
    2025

    June 30,
    2024

    March 30,
    2025

    Net loss from continuing operations

    $

    (4,862

    )

    $

    (2,082

    )

    $

    (7,098

    )

    $

    (4,130

    )

    $

    (2,245

    )

    Income tax benefit

    (1,392

    )

    (498

    )

    (2,031

    )

    (989

    )

    (630

    )

    Interest expense, net

    1,829

    1,105

    2,931

    2,386

    1,102

    Operating loss

    (4,425

    )

    (1,475

    )

    (6,198

    )

    (2,733

    )

    (1,773

    )

    Depreciation and amortization

    259

    332

    588

    671

    329

    Share-based compensation

    137

    220

    305

    439

    168

    Strategic alternatives review

    1,613

    280

    1,634

    349

    20

    Software as a service2

    291

    180

    425

    328

    134

    Aged receivable adjustment

    980

    199

    1,070

    324

    90

    Adjusted EBITDA from continuing operations

    (1,145

    )

    (264

    )

    (2,176

    )

    (622

    )

    (1,032

    )

    Adjusted EBITDA Margin (% of revenue)

    (4.9)

    %

    (1.0)

    %

    (4.9)

    %

    (1.2)

    %

    (5.4)

    %

    Income from discontinued operations

    1,126

    1,321

    2,640

    2,577

    1,522

    Adjustments to discontinued operations

    1,142

    1,901

    3,090

    4,001

    1,405

    Adjusted EBITDA from discontinued operations

    2,268

    3,222

    5,730

    6,578

    2,927

    Adjusted EBITDA, net

    $

    1,123

    $

    2,958

    $

    3,554

    $

    5,956

    $

    1,895

    2 We capitalize direct costs incurred in cloud computing implementation from hosting arrangements, which are reported as a Software as a service and are expensed as incurred in selling, general, and administrative expenses.

    Reconciliation of Net Loss EPS to Adjusted EPS

    Thirteen Weeks Ended

    Twenty-six Weeks Ended

    Thirteen Weeks Ended

    June 29,
    2025

    June 30,
    2024

    June 29,
    2025

    June 30,
    2024

    March 30,
    2025

    Net loss from continuing operations per diluted share

    $

    (0.44

    )

    $

    (0.19

    )

    $

    (0.65

    )

    $

    (0.38

    )

    $

    (0.21

    )

    Income tax benefit

    (0.13

    )

    (0.05

    )

    (0.18

    )

    (0.09

    )

    (0.06

    )

    Interest expense, net

    0.17

    0.10

    0.27

    0.22

    0.10

    Operating loss

    (0.40

    )

    (0.14

    )

    (0.56

    )

    (0.25

    )

    (0.17

    )

    Depreciation and amortization

    0.02

    0.03

    0.05

    0.06

    0.03

    Share-based compensation

    0.01

    0.02

    0.03

    0.04

    0.02

    Strategic alternatives review

    0.15

    0.03

    0.15

    0.03

    Software as a service2

    0.03

    0.02

    0.04

    0.03

    0.01

    Adjusted EPS from continuing operations

    (0.19

    )

    (0.04

    )

    (0.29

    )

    (0.09

    )

    (0.11

    )

    Adjusted EPS from discontinued operations

    0.21

    0.29

    0.52

    0.60

    0.27

    Adjusted EPS

    $

    0.02

    $

    0.25

    $

    0.23

    $

    0.51

    $

    0.16

    2 We capitalize direct costs incurred in cloud computing implementation from hosting arrangements, which are reported as a Software as a service and are expensed as incurred in selling, general, and administrative expenses.

    SOURCE: BGSF, INC.

    View the original press release on ACCESS Newswire

    The post BGSF, Inc. Reports Second Quarter 2025 Financial Results appeared first on Local News Hub.

  • Viemed Healthcare Announces Second Quarter 2025 Financial Results

    Viemed Healthcare Announces Second Quarter 2025 Financial Results

    LAFAYETTE, LA / ACCESS Newswire / August 6, 2025 / Viemed Healthcare, Inc. (the “Company” or “Viemed”) (NASDAQ:VMD), an in-home clinical care provider of post-acute respiratory healthcare equipment and services in the United States, announced today that it has reported its financial results for the three and six months ended June 30, 2025.

    Operational highlights (all dollar amounts are USD; comparisons are to the period ended June 30, 2024 unless otherwise noted):

    • Net revenues for the quarter ended June 30, 2025 were $63.1 million, setting another Company record, representing an increase of $8.1 million, or 14.7%, over net revenues reported for the comparable quarter ended June 30, 2024.

    • Net income attributable to Viemed for the quarter ended June 30, 2025 totaled $3.2 million, or $0.08per diluted share, an increase of 115.1% over net income attributable to Viemed of $1.5 million, or $0.04 per diluted share, for the quarter ended June 30, 2024.

    • Adjusted EBITDA for the quarter ended June 30, 2025 totaled $14.3 million, an 11.5% increase as compared to the quarter ended June 30, 2024. A reconciliation of reported non-GAAP financial measures to their most directly comparable U.S. GAAP financial measures can be found in the tables accompanying this press release.

    • During the second quarter of 2025, the Company repurchased and cancelled 270,061 common shares under its share repurchase program at a cost of $1.8 million, representing an average buyback price of $6.79 per share.

    • The Company increased its ventilator patient count to 12,152 as of June 30, 2025, an increase of 11.4% over June 30, 2024, and a 2.9% sequential increase from March 31,2025.

    • The Company increased its PAP therapy patient count to 26,260 as of June 30, 2025, an increase of 51.4% over June 30, 2024, and a 14.7% sequential increase from March 31,2025. The Company’s sleep resupply patient count was 25,246 as of June 30, 2025, an increase of 25.1% over June 30, 2024, and a 10.0% sequential increase from March 31,2025.

    • As of June 30, 2025, the Company maintains a strong cash balance of $20.0 million and an overall working capital balance of $18.0 million. Long term debt as of June 30, 2025 amounted to $3.5 million and the Company has $55 million available under existing credit facilities.

    • On July 1, 2025, Viemed closed on the previously announced acquisition of Lehan’s Medical Equipment (“Lehan”) for a base purchase price of $26 million, subject to customary adjustments, plus estimated contingent payments of $2.2 million. Financial results for Lehan will be included in the Company’s results beginning with the third quarter of 2025.

    Updated Full Year 2025 Guidance (all dollar amounts are USD):

    • Net revenue for the year ending December 31, 2025 is expected to be in the range of $271 million to $277 million, increased from the prior range of $256 million to $265 million. The increase in the range is primarily related to the inclusion of Lehan’s anticipated results for the second half of 2025.

    • Adjusted EBITDA for the year ending December 31, 2025 is expected to be in the range of $59 million to $62 million, increased from the prior range of $55 million to $58 million. The increase in the range is primarily related to the inclusion of Lehan’s anticipated results for the second half of 2025. See “Forward-Looking Statements” below for further information on this non-GAAP financial guidance.

    Casey Hoyt, Viemed’s CEO, noted, “Viemed’s focus as a company is on improving the quality of life for patients with compassionate care in the home. We are at the forefront of delivering greater patient satisfaction with better outcomes at a lower total cost of care, including in complex respiratory care and now women’s health driven by our acquisition of Lehan’s. During the past two years, we have significantly increased the patient populations we can address and invested in a technology-enabled clinical approach that extends the capabilities and impact of our certified Respiratory Therapists. Our model of care is rare in the industry, and we believe it will continue to serve us well in today’s rapidly evolving regulatory environment.

    “The solid execution of our vent and sleep businesses – together with continued leveraging of expenses – produced second quarter results that met our expectations and kept us on track for our organic growth targets in 2025. The addition of Lehan’s enabled us to increase our full year revenue and Adjusted EBITDA guidance, and the early progress from our integration plans reinforces the confidence we have in accelerating their growth. The strong operating cash flow during the quarter continues to contribute to our rock-solid balance sheet. We have successfully deployed that capital into share repurchases and have remained active to date with that program in the third quarter.”

    Conference Call Details

    The Company will host a conference call to discuss second quarter results on Thursday, August 7, 2025, at 11:00 a.m. EDT.

    Interested parties may participate in the call by dialing:

    877-407-6176 (US Toll-Free)
    +1 201-689-8451 (International)
    Live Audio Webcast: https://event.choruscall.com/mediaframe/webcast.html?webcastid=4jnXGdPH

    Following the conclusion of the call, an audio recording and transcript of the call can be accessed on the Company’s website.

    ABOUT VIEMED HEALTHCARE, INC.

    Viemed is an in-home clinical care provider of post-acute respiratory healthcare equipment and services in the United States, including non-invasive ventilators (NIV), sleep therapy, staffing, and other complementary products and services. Viemed focuses on efficient and effective in-home treatment with clinical practitioners providing therapy, education and counseling to patients in their homes using high-touch and high-tech services. Visit our website at www.viemed.com.

    For further information, please contact:

    Investor Relations
    ir@viemed.com

    SCR Partners, LLC
    Tripp Sullivan or Lisa Kampf

    Viemed Healthcare, Inc.
    Trae Fitzgerald
    Chief Financial Officer

    Forward-Looking Statements

    Certain statements contained in this press release may constitute “forward-looking statements” within the meaning of the U.S. Private Securities Litigation Reform Act of 1995 or “forward-looking information” as such term is defined in applicable Canadian securities legislation (collectively, “forward-looking statements”). Often, but not always, forward-looking statements can be identified by the use of words such as “plans”, “expects”, “is expected”, “budget”, “potential”, “scheduled”, “estimates”, “forecasts”, “intends”, “anticipates”, “believes”, “projects”, or the negatives thereof or variations of such words and phrases or statements that certain actions, events or results “will”, “should”, “may”, “could”, “would”, “might” or “will be taken”, “occur” or “be achieved” or the negative of these terms or comparable terminology. All statements other than statements of historical fact, including those that express, or involve discussions as to, expectations, beliefs, plans, objectives, assumptions or future events or performance, including the Company’s net revenue and Adjusted EBITDA guidance for 2025, and the anticipated synergies and other benefits of the acquisition of Lehan’s Medical Equipment, are not historical facts and may be forward-looking statements and may involve estimates, assumptions and uncertainties that could cause actual results or outcomes to differ materially from those expressed in the forward-looking statements. Such statements reflect the Company’s current views and intentions with respect to future events, and current information available to the Company, and are subject to certain risks, uncertainties and assumptions. Many factors could cause the actual results, performance or achievements that may be expressed or implied by such forward-looking statements to vary from those described herein should one or more of these risks or uncertainties materialize. These factors include, without limitation: the general business, market and economic conditions in the regions in which the we operate; significant capital requirements and operating risks that we may be subject to; our ability to implement business strategies and pursue business opportunities; volatility in the market price of our common shares; the state of the capital markets; the availability of funds and resources to pursue operations; inflation; reductions in reimbursement rates and audits of reimbursement claims by various governmental and private payor entities; dependence on few payors; possible new drug discoveries; dependence on key suppliers; granting of permits and licenses in a highly regulated business; competition; disruptions in or attacks (including cyber-attacks) on our information technology, internet, network access or other voice or data communications systems or services; the evolution of various types of fraud or other criminal behavior to which we are exposed; difficulty integrating newly acquired businesses; the impact of new and changes to, or application of, current laws and regulations; the overall difficult litigation and regulatory environment; increased competition; increased funding costs and market volatility due to market illiquidity and competition for funding; critical accounting estimates and changes to accounting standards, policies, and methods used by us; and the occurrence of natural and unnatural catastrophic events or health epidemics or concerns, and claims resulting from such events or concerns, as well as other general economic, market and business conditions; and other factors beyond our control; as well as those risk factors discussed or referred to in the Company’s disclosure documents filed with the U.S. Securities and Exchange Commission (the “SEC”) available on the SEC’s website at www.sec.gov, including the Company’s most recent Annual Report on Form 10-K and Quarterly Report on Form 10-Q, and with the securities regulatory authorities in certain provinces of Canada available at www.sedar.com. Should any factor affect the Company in an unexpected manner, or should assumptions underlying the forward-looking statements prove incorrect, the actual results or events may differ materially from the results or events predicted. Any such forward-looking statements are expressly qualified in their entirety by this cautionary statement. Moreover, the Company does not assume responsibility for the accuracy or completeness of such forward-looking statements. The forward-looking statements included in this press release are made as of the date of this press release and the Company undertakes no obligation to publicly update or revise any forward-looking statements, other than as required by applicable law.

    This press release contains non-GAAP financial guidance. There is no reliable or reasonably estimable comparable GAAP measure for the Company’s non-GAAP financial guidance because the Company is not able to reliably predict the impact of certain items that typically have one or more of the following characteristics: highly variable, difficult to project, unusual in nature, significant to the results of a particular period or not indicative of future operating results. Similar charges or gains were recognized in prior periods and will likely reoccur in future periods. As a result, reconciliation of the non-GAAP financial guidance to the most directly comparable GAAP measure is not available without unreasonable effort. In addition, the Company believes such a reconciliation would imply a degree of precision and certainty that could be confusing to investors. The variability of the specified items may have a significant and unpredictable impact on the Company’s future GAAP results.

    The Company’s financial guidance in this press release excludes the impact of potential future strategic acquisitions and any items that have not yet been identified or quantified. This guidance is subject to risks and uncertainties inherent in all forward-looking statements, as outlined above.

    VIEMED HEALTHCARE, INC.
    CONDENSED CONSOLIDATED BALANCE SHEETS
    (Expressed in thousands of U.S. Dollars, except share amounts)
    (Unaudited)

    At
    June 30, 2025
    At
    December 31, 2024
    ASSETS
    Current assets
    Cash and cash equivalents

    $

    20,016

    $

    17,540

    Accounts receivable, net

    26,549

    24,911

    Inventory

    4,324

    4,320

    Prepaid expenses and other assets

    4,402

    6,109

    Total current assets

    $

    55,291

    $

    52,880

    Long-term assets
    Property and equipment, net

    79,735

    76,279

    Finance lease right-of-use assets

    13

    50

    Operating lease right-of-use assets

    2,639

    2,831

    Equity investments

    2,794

    2,794

    Deferred tax asset

    10,359

    8,398

    Identifiable intangibles, net

    783

    848

    Goodwill

    32,989

    32,989

    Total long-term assets

    $

    129,312

    $

    124,189

    TOTAL ASSETS

    $

    184,603

    $

    177,069

    LIABILITIES
    Current liabilities
    Trade payables

    $

    8,253

    $

    5,322

    Deferred revenue

    7,193

    6,694

    Income taxes payable

    1,450

    3,883

    Accrued liabilities

    18,644

    20,157

    Finance lease liabilities, current portion

    15

    50

    Operating lease liabilities, current portion

    895

    811

    Current portion of long-term debt

    820

    409

    Total current liabilities

    $

    37,270

    $

    37,326

    Long-term liabilities
    Accrued liabilities

    549

    846

    Operating lease liabilities, less current portion

    1,695

    2,007

    Long-term debt

    3,465

    3,589

    Total long-term liabilities

    $

    5,709

    $

    6,442

    TOTAL LIABILITIES

    $

    42,979

    $

    43,768

    Commitments and Contingencies

    SHAREHOLDERS’ EQUITY
    Common stock – No par value: unlimited authorized; 39,605,005 and 39,132,897 issued and outstanding as of June 30, 2025 and December 31, 2024, respectively

    27,787

    23,365

    Additional paid-in capital

    18,102

    18,337

    Retained earnings

    93,842

    89,691

    TOTAL VIEMED HEALTHCARE, INC.’S SHAREHOLDERS’ EQUITY

    $

    139,731

    $

    131,393

    Noncontrolling interest in subsidiary

    1,893

    1,908

    TOTAL SHAREHOLDERS’ EQUITY

    141,624

    133,301

    TOTAL LIABILITIES AND SHAREHOLDERS’ EQUITY

    $

    184,603

    $

    177,069

    VIEMED HEALTHCARE, INC.
    CONDENSED CONSOLIDATED STATEMENTS OF INCOME
    (Expressed in thousands of U.S. Dollars, except outstanding shares and per share amounts)
    (Unaudited)

    Three Months Ended June 30,

    Six Months Ended June 30,

    2025

    2024

    2025

    2024

    Revenue

    $

    63,056

    $

    54,965

    $

    122,185

    $

    105,558

    Cost of revenue

    26,325

    22,073

    52,175

    42,864

    Gross profit

    $

    36,731

    $

    32,892

    $

    70,010

    $

    62,694

    Operating expenses
    Selling, general and administrative

    28,803

    26,503

    57,228

    51,317

    Research and development

    847

    758

    1,644

    1,508

    Stock-based compensation

    2,341

    1,620

    4,652

    3,052

    Depreciation and amortization

    353

    377

    701

    792

    Gain on disposal of property and equipment

    (636

    )

    (545

    )

    (3,004

    )

    (332

    )

    Other expense (income), net

    (72

    )

    563

    (147

    )

    537

    Income from operations

    $

    5,095

    $

    3,616

    $

    8,936

    $

    5,820

    Non-operating income and expenses
    Loss on investments

    (1,117

    )

    (1,050

    )

    Interest expense, net

    (132

    )

    (254

    )

    (311

    )

    (404

    )

    Net income before taxes

    4,963

    2,245

    8,625

    4,366

    Provision for income taxes

    1,713

    768

    2,665

    1,286

    Net income

    $

    3,250

    $

    1,477

    $

    5,960

    $

    3,080

    Net income attributable to noncontrolling interest

    93

    9

    178

    9

    Net income attributable to Viemed Healthcare, Inc.

    $

    3,157

    $

    1,468

    $

    5,782

    $

    3,071

    Net income per share
    Basic

    $

    0.08

    $

    0.04

    $

    0.15

    $

    0.08

    Diluted

    $

    0.08

    $

    0.04

    $

    0.14

    $

    0.08

    Weighted average number of common shares outstanding:
    Basic

    39,515,247

    38,822,980

    39,471,244

    38,558,479

    Diluted

    41,083,760

    40,553,449

    41,393,523

    40,313,042

    VIEMED HEALTHCARE, INC.
    CONDENSED CONSOLIDATED STATEMENTS OF CASH FLOWS
    (Expressed in thousands of U.S. Dollars)
    (Unaudited)

    Six Months Ended June 30,

    2025

    2024

    Cash flows from operating activities
    Net income

    $

    5,960

    $

    3,080

    Adjustments for:
    Depreciation and amortization

    13,504

    12,594

    Stock-based compensation expense

    4,652

    3,052

    Distributions of earnings received from equity method investments

    147

    Income from equity method investments

    (261

    )

    Loss from debt investment

    1,219

    Gain on disposal of property and equipment

    (3,004

    )

    (332

    )

    Amortization of deferred financing costs

    64

    85

    Deferred income tax benefit

    (1,961

    )

    Changes in working capital:
    Accounts receivable, net

    (1,638

    )

    (8,225

    )

    Inventory

    (4

    )

    470

    Prepaid expenses and other assets

    (150

    )

    1,523

    Trade payables

    1,598

    1,114

    Deferred revenue

    499

    394

    Accrued liabilities

    (1,979

    )

    (904

    )

    Income tax payable/receivable

    (2,433

    )

    (2,599

    )

    Net cash provided by operating activities

    $

    15,108

    $

    11,357

    Cash flows from investing activities
    Purchase of property and equipment

    (23,612

    )

    (14,940

    )

    Cash paid for acquisitions, net of cash acquired

    (2,999

    )

    Proceeds from sale of property and equipment

    13,355

    1,407

    Net cash used in investing activities

    $

    (10,257

    )

    $

    (16,532

    )

    Cash flows from financing activities
    Proceeds from exercise of options

    1,368

    325

    Principal payments on term notes

    (220

    )

    (810

    )

    Proceeds from revolving credit facilities

    3,000

    Payments for debt issuance costs

    (151

    )

    Shares redeemed to pay income tax

    (1,631

    )

    (972

    )

    Shares repurchased under the share repurchase program

    (1,664

    )

    Repayments of finance lease liabilities

    (35

    )

    (249

    )

    Distributions to non-controlling interest

    (193

    )

    Net cash provided by (used in) financing activities

    $

    (2,375

    )

    $

    1,143

    Net increase (decrease) in cash and cash equivalents

    2,476

    (4,032

    )

    Cash and cash equivalents at beginning of year

    17,540

    12,839

    Cash and cash equivalents at end of period

    $

    20,016

    $

    8,807

    Supplemental disclosures of cash flow information
    Cash paid during the period for interest

    $

    212

    $

    515

    Cash paid during the period for income taxes, net of refunds

    $

    7,059

    $

    3,841

    Supplemental disclosures of non-cash transactions
    Equipment and other fixed asset purchases payable at end of period

    $

    3,955

    $

    2,725

    Equipment sales receivable at end of period

    $

    986

    $

    2,187

    Repurchases of shares not yet settled

    $

    169

    $

    Non-GAAP Financial Measures

    This press release refers to “Adjusted EBITDA”, which is a financial measure that is not prepared in accordance with generally accepted accounting principles in the United States (“GAAP”). Adjusted EBITDA should be considered in addition to, not as a substitute for, or superior to, financial measures calculated in accordance with U.S. GAAP. Management believes Adjusted EBITDA provides helpful information with respect to the Company’s operating performance as viewed by management, including a view of the Company’s business that is not dependent on the impact of the Company’s capitalization structure and items that are not part of the Company’s day-to-day operations. Management uses Adjusted EBITDA (i) to compare the Company’s operating performance on a consistent basis, (ii) to calculate incentive compensation for the Company’s employees, (iii) for planning purposes, including the preparation of the Company’s internal annual operating budget, and (iv) to evaluate the performance and effectiveness of the Company’s operational strategies. Accordingly, management believes that Adjusted EBITDA provides useful information in understanding and evaluating the Company’s operating performance in the same manner as management. Adjusted EBITDA is not a measurement of the Company’s financial performance under U.S. GAAP and should not be considered as an alternative to revenue or net income, as applicable, or any other performance measures derived in accordance with U.S. GAAP. Adjusted EBITDA has limitations as an analytical tool and you should not consider it in isolation or as a substitute for analysis of the Company’s operating results as reported under U.S. GAAP. Adjusted EBITDA does not reflect the impact of certain cash charges resulting from matters the Company considers not to be indicative of ongoing operations; and other companies in the Company’s industry may calculate Adjusted EBITDA differently than we do, limiting its usefulness as a comparative measure. In calculating Adjusted EBITDA, certain items (mostly non-cash) are excluded from net income attributable to Viemed Healthcare, Inc., including depreciation and amortization of capitalized assets, net interest expense, stock based compensation, transaction costs, impairment of assets, and taxes.

    The following table is a reconciliation of net income attributable to Viemed Healthcare, Inc., the most directly comparable U.S. GAAP measure, to Adjusted EBITDA, on a historical basis for the periods indicated:

    VIEMED HEALTHCARE, INC.
    Reconciliation of Net Income to Non-GAAP Adjusted EBITDA
    (Expressed in thousands of U.S. Dollars)
    (Unaudited)

    For the quarter ended

    June 30, 2025

    March 31, 2025

    December 31, 2024

    September 30, 2024

    June 30, 2024

    March 31, 2024

    December 31, 2023

    September 30, 2023

    Net income attributable to Viemed Healthcare, Inc.

    $

    3,157

    $

    2,625

    $

    4,316

    $

    3,878

    $

    1,468

    $

    1,603

    $

    3,477

    $

    2,919

    Add back:
    Depreciation & amortization

    6,891

    6,613

    6,366

    6,408

    6,309

    6,285

    5,918

    5,975

    Interest expense, net

    132

    179

    147

    225

    254

    150

    256

    237

    Stock-based compensation(a)

    2,341

    2,311

    1,521

    1,712

    1,620

    1,432

    1,534

    1,453

    Transaction costs(b)

    53

    85

    11

    12

    221

    110

    61

    177

    Impairment of assets(c)

    125

    2,173

    Income tax expense

    1,713

    952

    1,881

    1,594

    768

    518

    1,599

    1,320

    Adjusted EBITDA

    $

    14,287

    $

    12,765

    $

    14,242

    $

    13,954

    $

    12,813

    $

    10,098

    $

    12,845

    $

    12,081

    (a) Represents non-cash, equity-based compensation expense associated with option and RSU awards.

    (b) Represents transaction costs and expenses related to acquisition and integration efforts associated with recently announced or completed acquisitions.

    (c) Represents impairments of the fair value of investment and litigation-related assets.

    VIEMED HEALTHCARE, INC.
    Key Financial and Operational Information
    (Expressed in thousands of U.S. Dollars, except vent patients)
    (Unaudited)

    For the quarter ended

    June 30, 2025

    March 31, 2025

    December 31, 2024

    September 30, 2024

    June 30, 2024

    March 31, 2024

    December 31, 2023

    September 30, 2023

    Financial Information:

    Revenue

    $

    63,056

    $

    59,129

    $

    60,695

    $

    58,004

    $

    54,965

    $

    50,593

    $

    50,739

    $

    49,402

    Gross Profit

    $

    36,731

    $

    33,279

    $

    36,138

    $

    34,371

    $

    32,892

    $

    29,802

    $

    32,111

    $

    30,562

    Gross Profit %

    58

    %

    56

    %

    60

    %

    59

    %

    60

    %

    59

    %

    63

    %

    62

    %

    Net Income attributable to Viemed Healthcare, Inc.

    $

    3,157

    $

    2,625

    $

    4,316

    $

    3,878

    $

    1,468

    $

    1,603

    $

    3,477

    $

    2,919

    Cash and Cash Equivalents (As of)

    $

    20,016

    $

    10,160

    $

    17,540

    $

    11,347

    $

    8,807

    $

    7,309

    $

    12,839

    $

    10,078

    Total Assets (As of)

    $

    184,603

    $

    178,079

    $

    177,069

    $

    169,526

    $

    163,947

    $

    154,875

    $

    154,895

    $

    149,400

    Adjusted EBITDA(1)

    $

    14,287

    $

    12,765

    $

    14,242

    $

    13,954

    $

    12,813

    $

    10,098

    $

    12,845

    $

    12,081

    Operational Information:

    Vent Patients(2)

    12,152

    11,809

    11,795

    11,374

    10,905

    10,450

    10,327

    10,244

    PAP Therapy Patients(3)

    26,260

    22,899

    21,338

    19,478

    17,349

    15,726

    14,900

    14,788

    Sleep Resupply Patients(4)

    25,246

    22,941

    24,478

    22,143

    20,185

    18,904

    18,902

    18,544

    (1) Refer to “Non-GAAP Financial Measures” section above for definition of Adjusted EBITDA.

    (2) Vent Patients represents the number of active ventilator patients on recurring billing service at the end of each calendar quarter.

    (3) PAP Therapy Patients represents the number of distinct patients billed for PAP therapy services during each calendar quarter.

    (4) Sleep Resupply Patients represents the number of distinct patients who received supplies through our sleep resupply program during each calendar quarter.

    SOURCE: Viemed Healthcare, Inc.

    View the original press release on ACCESS Newswire

    The post Viemed Healthcare Announces Second Quarter 2025 Financial Results appeared first on Local News Hub.

  • Gladstone Commercial Corporation Reports Results for the Second Quarter Ended June 30, 2025

    Gladstone Commercial Corporation Reports Results for the Second Quarter Ended June 30, 2025

    Please note that the limited information that follows in this press release is not adequate to make an informed investment judgment.

    MCLEAN, VA / ACCESS Newswire / August 6, 2025 / Gladstone Commercial Corporation (Nasdaq:GOOD) (“Gladstone Commercial” or the “Company”) today reported financial results for the second quarter ended June 30, 2025. A description of funds from operations, or FFO, and Core FFO, both non-GAAP (generally accepted accounting principles in the United States) financial measures, are located at the end of this press release. All per share references are to fully-diluted weighted average shares of common stock and Non-controlling OP Units, unless otherwise noted. For further detail, please also refer to both the quarterly financial supplement and the Company’s Quarterly Report on Form 10-Q, which can be retrieved from the Investors section of our website at www.gladstonecommercial.com.

    Summary Information (dollars in thousands, except share and per share data):

    As of and for the three months ended

    June 30, 2025

    March 31, 2025

    $ Change

    % Change

    Operating Data:
    Total operating revenue

    $

    39,533

    $

    37,501

    $

    2,032

    5.4

    %

    Total operating expenses

    (25,146

    )

    (1)

    (23,858

    )

    (1,288

    )

    5.4

    %

    Other expense, net

    (9,753

    )

    (2)

    (8,507

    )

    (1,246

    )

    14.6

    %

    Net income

    $

    4,634

    $

    5,136

    $

    (502

    )

    (9.8)

    %

    Less: Dividends attributable to preferred stock

    (3,085

    )

    (3,108

    )

    23

    (0.7)

    %

    Less: Dividends attributable to senior common stock

    (101

    )

    (101

    )

    %

    Add/Less: Gain (loss) on extinguishment of Series F preferred stock, net

    9

    (10

    )

    19

    (190.0)

    %

    Net income available to common stockholders and Non-controlling OP Unitholders

    $

    1,457

    $

    1,917

    $

    (460

    )

    (24.0)

    %

    Add: Real estate depreciation and amortization

    14,249

    13,243

    1,006

    7.6

    %

    Add: Impairment charge

    9

    9

    100.0

    %

    Less: Gain on sale of real estate, net

    (377

    )

    (377

    )

    100.0

    %

    Funds from operations available to common stockholders and Non-controlling OP Unitholders – basic

    $

    15,338

    $

    15,160

    $

    178

    1.2

    %

    Add: Convertible senior common distributions

    101

    101

    %

    Funds from operations available to common stockholders and Non-controlling OP Unitholders – diluted

    $

    15,439

    $

    15,261

    $

    178

    1.2

    %

    Funds from operations available to common stockholders and Non-controlling OP Unitholders – basic

    $

    15,338

    $

    15,160

    $

    178

    1.2

    %

    Add: Write off prepaid offering costs

    305

    305

    100.0

    %

    Add: Asset retirement obligation expense

    34

    34

    %

    Add: Closing costs on sale

    336

    336

    100.0

    %

    Core funds from operations available to common stockholders and Non-controlling OP Unitholders – basic

    $

    16,013

    $

    15,194

    $

    819

    5.4

    %

    Add: Convertible senior common distributions

    101

    101

    %

    Core funds from operations available to common stockholders and Non-controlling OP Unitholders – diluted

    $

    16,114

    $

    15,295

    $

    819

    5.4

    %

    Share and Per Share Data:
    Net income available to common stockholders and Non-controlling OP Unitholders – basic and diluted

    $

    0.03

    $

    0.04

    $

    (0.01

    )

    (25.0)

    %

    FFO available to common stockholders and Non-controlling OP Unitholders – basic

    $

    0.33

    $

    0.34

    $

    (0.01

    )

    (2.9)

    %

    FFO available to common stockholders and Non-controlling OP Unitholders – diluted

    $

    0.33

    $

    0.34

    $

    (0.01

    )

    (2.9)

    %

    Core FFO available to common stockholders and Non-controlling OP Unitholders – basic

    $

    0.35

    $

    0.34

    $

    0.01

    2.9

    %

    Core FFO available to common stockholders and Non-controlling OP Unitholders – diluted

    $

    0.35

    $

    0.34

    $

    0.01

    2.9

    %

    Weighted average shares of common stock and Non-controlling OP Units outstanding – basic

    46,259,137

    44,646,486

    1,612,651

    3.6

    %

    Weighted average shares of common stock and Non-controlling OP Units outstanding – diluted

    46,587,696

    44,975,890

    1,611,806

    3.6

    %

    Cash dividends declared per common share and Non-controlling OP Unit

    $

    0.30

    $

    0.30

    $

    %

    Financial Position
    Real estate, before accumulated depreciation

    $

    1,350,523

    (3)

    $

    1,287,663

    (4)

    $

    62,860

    4.9

    %

    Total assets

    $

    1,209,993

    $

    1,160,443

    $

    49,550

    4.3

    %

    Mortgage notes payable, net, borrowings under revolver, borrowings under term loan, net, borrowings under unsecured term loan, net, and senior unsecured notes, net

    $

    794,391

    $

    740,746

    $

    53,645

    7.2

    %

    Total equity and mezzanine equity

    $

    347,362

    $

    353,393

    $

    (6,031

    )

    (1.7)

    %

    Properties owned

    143

    (3)

    141

    (4)

    2

    1.4

    %

    Square feet owned

    17,038,727

    (3)

    17,255,665

    (4)

    (216,938

    )

    (1.3)

    %

    Square feet leased

    98.7

    %

    98.4

    %

    0.3

    %

    0.3

    %

    (1) Includes a $0.01 million impairment charge recognized on one property during the three months ended June 30, 2025.
    (2) Includes a $0.4 million gain on sale, net, from the sale of one property during the three months ended June 30, 2025.
    (3) Includes one property classified as held for sale of $3.4 million and 56,000 square feet.
    (4) Includes two properties classified as held for sale of $8.1 million and 736,031 square feet, in the aggregate.

    Second Quarter Activity:

    • Collected 100% of cash rents: Collected 100% of cash rents due during April, May, and June;

    • Acquired properties: Purchased two fully-occupied facilities, with an aggregate of 519,093 square feet of rental space, for $79.3 million, at a weighted average cap rate of 8.88%;

    • Sold properties: Sold one non-core office property as part of our capital recycling strategy for $5.1 million and completed the sale transaction on one non-core industrial property for $18.5 million;

    • Renewed space: Renewed 55,308 square feet with a remaining lease term of 0.8 years at one of our properties;

    • Issued common stock under ATM Program: Issued 750,426 shares of common stock under our at-the-market (“ATM”) program for net proceeds of $10.4 million;

    • Issued Series F Preferred Stock: Issued 2,200 shares of our Series F Preferred Stock for net proceeds of $0.1 million;

    • Repaid debt: Repaid $7.2 million in variable rate mortgage debt at an interest rate of SOFR + 2.25%; and

    • Paid distributions: Paid monthly cash distributions for the quarter totaling $0.30 per share on our common stock and Non-controlling OP Units, $0.414063 per share on our Series E Preferred Stock, $0.375 per share on our Series F Preferred Stock, $0.375 per share on our Series G Preferred Stock, and $0.2625 per share on our senior common stock.

    Second Quarter 2025 Results: Core FFO available to common shareholders and Non-controlling OP Unitholders for the three months ended June 30, 2025 was $16.1 million, a 5.4% increase when compared to the three months ended March 31, 2025, equaling $0.35 per share. Core FFO increased primarily due to higher revenues from year to date acquisitions and a lower net incentive fee, partially offset by an increase in interest expense from higher outstanding variable rate debt and higher general and administrative expenses.

    Net income available to common stockholders and Non-controlling OP Unitholders for the three months ended June 30, 2025 was $1.5 million, or $0.03 per share, compared to net income available to common stockholders and Non-controlling OP Unitholders for the three months ended March 31, 2025 of $1.9 million, or $0.04 per share. In the Summary Information table above, we provide a reconciliation of Core FFO to net income (which we believe is the most directly comparable GAAP measure to Core FFO) for the three months ended June 30, 2025 and March 31, 2025, a computation of basic and diluted Core FFO per weighted average share of common stock and Non-controlling OP Unit, and basic and diluted net income per weighted average share of common stock and Non-controlling OP Unit.

    Subsequent to the end of the quarter:

    • Collected 100% of July cash rents: Collected 100% of cash rents due in July;

    • Leased or renewed space: Leased or renewed 143,844 square feet with remaining lease terms ranging from 5.3 to 11.4 years at two of our properties;

    • Issued common stock under ATM Program: Issued 50,540 shares of common stock under our ATM program for net proceeds of $0.7 million; and

    • Declared distributions: Declared monthly cash distributions for July, August, and September 2025, totaling $0.30 per share on our common stock and Non-controlling OP Units, $0.414063 per share on our Series E Preferred Stock, $0.375 per share on our Series F Preferred Stock, $0.375 per share on our Series G Preferred Stock, and $0.2625 per share on our senior common stock.

    Comments from Gladstone Commercial’s President, Buzz Cooper: “Our financial results reflect consistent performance and stabilized revenues from our tremendous same store property occupancy, rent collection and growth, accretive real estate investments made during 2024 and 2025, our ability to renew tenants, and our deleveraging. We have continued our capital recycling program, whereby we have sold non-core assets and used the proceeds to de-lever our portfolio, as well as acquire properties in our target growth markets. We have successfully exited two non-core assets thus far in 2025, and we have additional non-core assets we anticipate selling over the next one to two years that we believe will result in capital gains. We will continue to opportunistically sell non-core assets and redeploy the proceeds into stronger target growth markets with a focus on industrial investment opportunities. While we expect to face challenges due to the lingering effects of the pandemic, significant inflation with a corresponding increase in interest rates, and the geo-political and economic issues arising from international wars, we feel strongly about the depth of our tenant credit underwriting. We have collected 100% of the first two quarters’ cash rents and 100% of July cash rents. We anticipate our tenants will successfully navigate the current economic climate and will be able to continue operating successfully when economic normalcy returns fully. Despite economic uncertainty, so far during 2025, we renewed or newly leased 266,861 square feet of property with six tenants. We are actively marketing our remaining vacant space and currently anticipate positive outcomes. We expect to continue to have access to the debt and equity markets, as necessary, for added liquidity. We believe our same store rents, which have increased by 2% annually in recent years, should continue to rise as we grow, and we will continue to primarily focus on investing in our target markets, with an emphasis on industrial properties and actively managing our portfolio.”

    Conference Call: Gladstone Commercial will hold a conference call on Thursday, August 7, 2025, at 8:30 a.m. Eastern Time to discuss its earnings results. Please call (877) 407-9045 to enter the conference call. An operator will monitor the call and set a queue for questions. A conference call replay will be available beginning one hour after the call and will be accessible through August 14, 2025. To hear the replay, please dial (877) 660-6853 and use playback conference number 13754186. The live audio broadcast of the Company’s quarterly conference call will also be available on the investors section of our website, www.gladstonecommercial.com.

    About Gladstone Commercial: Gladstone Commercial Corporation is a real estate investment trust focused on acquiring, owning, and operating net leased industrial and office properties across the United States. Further information can be found at www.gladstonecommercial.com.

    About the Gladstone Companies: Information on the business activities of the Gladstone family of funds can be found at www.gladstonecompanies.com.

    Investor Relations: For Investor Relations inquiries related to any of the monthly distribution-paying Gladstone family of funds, please visit www.gladstonecompanies.com.

    Non-GAAP Financial Measures:

    FFO: The National Association of Real Estate Investment Trusts (“NAREIT”) developed FFO as a relative non-GAAP supplemental measure of operating performance of an equity REIT to recognize that income-producing real estate historically has not depreciated on the basis determined under GAAP. FFO, as defined by NAREIT, is net income (computed in accordance with GAAP), excluding gains (or losses) from sales of property and impairment losses on property, plus depreciation and amortization of real estate assets, and after adjustments for unconsolidated partnerships and joint ventures. FFO does not represent cash flows from operating activities determined in accordance with GAAP and should not be considered an alternative to net income as an indication of its performance or to cash flow from operations as a measure of liquidity or ability to make distributions. The Company believes that FFO per share provides investors with an additional context for evaluating its financial performance and as a supplemental measure to compare it to other REITs; however, comparisons of its FFO to the FFO of other REITs may not necessarily be meaningful due to potential differences in the application of the NAREIT definition used by such other REITs.

    Core FFO: Core FFO is FFO adjusted for certain items that are not indicative of the results provided by the Company’s operating portfolio and affect the comparability of the Company’s period-over-period performance. These items include the adjustment for acquisition related expenses, gains or losses from early extinguishment of debt and any other non-recurring expense adjustments. Although the Company’s calculation of Core FFO differs from NAREIT’s definition of FFO and may not be comparable to that of other REITs, the Company believes it is a meaningful supplemental measure of its operating performance. Accordingly, Core FFO should be considered a supplement to net income computed in accordance with GAAP as a measure of our performance.

    The Company’s presentation of FFO, as defined by NAREIT, or presentation of Core FFO, does not represent cash flows from operating activities determined in accordance with GAAP and should not be considered an alternative to net income as an indication of its performance or to cash flow from operations as a measure of liquidity or ability to make distributions.

    The statements in this press release regarding the forecasted stability of Gladstone Commercial’s income, its ability, plans or prospects to re-lease its unoccupied properties, and grow its portfolio are “forward-looking statements” within the meaning of Section 27A of the Securities Act of 1933, as amended, and Section 21E of the Securities Exchange Act of 1934, as amended. These forward-looking statements inherently involve certain risks and uncertainties, although they are based on Gladstone Commercial’s current plans that are believed to be reasonable as of the date of this press release. Factors that may cause actual results to differ materially from these forward-looking statementsinclude, but are not limited to, Gladstone Commercial’s ability to raise additional capital; availability and terms of capital and financing, both to fund its operations and to refinance its indebtedness as it matures; downturns in the current economic environment; the performance of its tenants; the impact of competition on its efforts to renew existing leases or re-lease space; and significant changes in interest rates.Additional factors that could cause actual results to differ materially from those stated or implied by its forward-looking statements are disclosed under the caption “Risk Factors” of its Form 10-K for the fiscal year ended December 31, 2024, as filed with the SEC on February 18, 2025, and other reports filed with the SEC.Gladstone Commercial cautions readers not to place undue reliance on any such forward-looking statements, which speak only as of the date made.Gladstone Commercial undertakes no obligation to publicly update or revise any forward-looking statements, whether as a result of new information, future events or otherwise, except as required by law.

    CONTACT:

    Gladstone Commercial Corporation
    (703) 287-5893

    SOURCE: Gladstone Commercial Corporation

    View the original press release on ACCESS Newswire

    The post Gladstone Commercial Corporation Reports Results for the Second Quarter Ended June 30, 2025 appeared first on Local News Hub.

  • FRP Holdings, Inc. Reports Fiscal 2025 Second Quarter Results

    FRP Holdings, Inc. Reports Fiscal 2025 Second Quarter Results

    JACKSONVILLE, FL / ACCESS Newswire / August 6, 2025 / FRP Holdings, Inc. (NASDAQ:FRPH), a full-service real estate investment and development company with four distinct business segments including Multifamily, Industrial and Commercial Development, Mining and Royalty Lands, today reported financial results for the quarter ended June 30, 2025.

    Second Quarter Highlights and Recent Developments

    • 72% decrease in Net Income ($0.6 million vs $2.0 million) due largely to legal expenses related to due diligence for a potential investment the company is evaluating, as well as lower Net Interest Income offset by higher mining royalties and improved results in Equity in Loss of Joint Ventures

    • 5% increase in pro rata NOI ($9.7 million vs $9.2 million)

    • 1% increase in the Multifamily segment’s pro rata NOI primarily due to improved occupancy of The Verge and Dock 79. This comparison includes the results for The Verge from the same period last year (when the Verge was still in our Development segment).

    • 15% decrease in Industrial and Commercial segment NOI primarily due to an eviction of one tenant and lease expirations.

    • 21% increase in NOI for Mining Royalty Lands segment

    • Effective July 21, 2025, the Company entered into a 2025 Amended and Restated Credit Agreement (the “Credit Agreement”) with Wells Fargo Bank, N.A. The Credit Agreement modifies the Company’s prior Credit Agreement with Wells Fargo dated December 22, 2023. The Credit Agreement establishes a five-year revolving credit facility with a maximum facility amount of $50 million. The interest rate under the Credit Agreement will be 2.25% over the Daily Simple SOFR in effect. A commitment fee of 0.35% per annum is payable quarterly on the unused portion of the commitment.

    • On July 23, 2025, subsequent to quarters end, we entered into a joint venture agreement with Strategic Real Estate Partners (“SREP”), a private real estate development firm which specializes in industrial real estate development, to develop 377,892 square feet in two warehouses in Lake County, Florida near Orlando, with options for investment in additional industrial warehouses on adjacent properties in the future.

    Executive Summary and Analysis

    Results this quarter and for the first six months are consistent with both our expectations as well as what we cautioned investors to expect for the last two quarters. As stated previously, our primary aim for 2025 is to set the stage for future growth. We will accomplish this first by leasing up our current vacancies, but mostly by putting money to work in new projects. We have started construction on both our JVs with Altman Logistics in Lakeland and Broward County, FL which will add 384,193 square feet of class A industrial space to our portfolio. We expect substantial completion on these projects in the second quarter of 2026. Work continues on the entitlements for our industrial pipeline in Maryland in order to be shovel ready in 2026. Finally, as mentioned in our highlights, subsequent to the end of the quarter, the Company entered into a joint venture agreement to develop 377,892 square feet in two warehouses in Lake County, FL. The site is located off the Florida Turnpike, in the City of Minneola, outside of Orlando. The lack of available land in the broader Orlando market has driven industrial users to expand into the Lake County submarket, attracting both institutional owners and users. Notably, there remains a meaningful shortage of shallow bay industrial buildings in the size range of the buildings we are developing for this market. We expect to begin construction on this project this month and FRP will have a 95% interest in this joint venture, with options for future development of just under 1 million SF of industrial product on adjacent property. This agreement supports our shift in focus and investment toward our industrial business segment and the Company remains on track to deliver three new industrial assets every two years with the goal of doubling the size of our industrial segment by 2030.

    Comparative Results of Operations for the three months ended June 30, 2025 and 2024

    Consolidated Results

    (dollars in thousands)

    Three Months Ended June 30,

    2025

    2024

    Change

    %

    Revenues:
    Lease revenue

    $

    7,241

    7,246

    $

    (5

    )

    -.1

    %

    Mining royalty and rents

    3,609

    3,231

    378

    11.7

    %

    Total revenues

    10,850

    10,477

    373

    3.6

    %

    Cost of operations:
    Depreciation, depletion and amortization

    2,726

    2,543

    183

    7.2

    %

    Operating expenses

    2,580

    1,702

    878

    51.6

    %

    Property taxes

    1,002

    860

    142

    16.5

    %

    General and administrative

    2,885

    2,552

    333

    13.0

    %

    Total cost of operations

    9,193

    7,657

    1,536

    20.1

    %

    Total operating profit

    1,657

    2,820

    (1,163

    )

    -41.2

    %

    Net investment income

    2,348

    3,708

    (1,360

    )

    -36.7

    %

    Interest expense

    (824

    )

    (829

    )

    5

    -.6

    %

    Equity in loss of joint ventures

    (2,379

    )

    (2,724

    )

    345

    -12.7

    %

    Income before income taxes

    802

    2,975

    (2,173

    )

    -73.0

    %

    Provision for income taxes

    178

    916

    (738

    )

    -80.6

    %

    Net income

    624

    2,059

    (1,435

    )

    -69.7

    %

    Income (loss) attributable to noncontrolling interest

    46

    15

    31

    206.7

    %

    Net income attributable to the Company

    $

    578

    2,044

    $

    (1,466

    )

    -71.7

    %

    Net income for the second quarter of 2025 was $578,000 or $.03 per share versus $2,044,000 or $.11 per share in the same period last year. Pro rata NOI for the second quarter of 2025 was $9,688,000 versus $9,230,000 in the same period last year. The second quarter of 2025 was impacted by the following items:

    • Operating profit decreased $1,163,000 primarily as a result of higher Development segment professional fees ($831,000) and higher General and administrative expense ($333,000). Development segment professional fees included $712,000 of legal expenses related to due diligence for a potential investment the company is evaluating along with other expensed acquisition and development costs. General and administrative expense increased primarily because of overlapping compensation as a result of the implementation of our executive succession and transition plan that commenced in June, 2024. Industrial and commercial segment operating profit declined $387,000 due to $211,000 higher depreciation from completion of our new Chelsea warehouse along with lower occupancy due to a tenant default and non-renewing leases. Mining Royalty Land’s segment operating profit increased $355,000 primarily due to the prior year including a $277,000 overpayment deduction.

    • Net investment income decreased $1,360,000 because of reduced earnings on cash equivalents ($456,000) primarily due to lower interest rates and lower income from our lending ventures ($904,000) primarily due to 27 residential lots sold compared to 54 residential lots sold in the same quarter last year.

    • Equity in loss of Joint Ventures improved $345,000 due to improved results of our unconsolidated joint ventures. Results improved at The Verge ($90,000) due to improved occupancy and at Bryant Street ($212,000) and BC Realty ($115,000) both due to higher revenues and lower variable rate interest expense.

    Multifamily Segment (Pro rata consolidated and pro rata unconsolidated)

    For ease of comparison all the figures in the tables below include the results for The Verge from the same period last year (when this project was still in our Development segment).

    Three months ended June 30

    (dollars in thousands)

    2025

    %

    2024

    %

    Change

    %

    Lease revenue

    $

    8,467

    100.0

    %

    8,113

    100.0

    %

    354

    4.4

    %

    Depreciation and amortization

    3,386

    40.0

    %

    3,384

    41.7

    %

    2

    .1

    %

    Operating expenses

    2,691

    31.8

    %

    2,553

    31.5

    %

    138

    5.4

    %

    Property taxes

    1,008

    11.9

    %

    912

    11.2

    %

    96

    10.5

    %

    Cost of operations

    7,085

    83.7

    %

    6,849

    84.4

    %

    236

    3.4

    %

    Operating profit before G&A

    $

    1,382

    16.3

    %

    1,264

    15.6

    %

    118

    9.3

    %

    Depreciation and amortization

    3,386

    3,384

    2

    Unrealized rents & other

    (31

    )

    32

    (63

    )

    Net operating income

    $

    4,737

    55.9

    %

    4,680

    57.7

    %

    57

    1.2

    %

    The combined consolidated and unconsolidated pro rata net operating income this quarter for this segment was $4,737,000, up $57,000 or 1% compared to $4,680,000 in the same quarter last year. Most of this increase was from the improved occupancy of The Verge. This project contributed $733,000 of pro rata NOI to this segment compared to $710,000 in the Development segment in the same quarter last year, an increase of $23,000. Same store NOI increased $34,000 as favorable revenues at Dock 79 were partially offset by lower revenues at the Maren and higher property taxes.

    Apartment Building

    Units

    Pro rata NOI
    Q2 2025
    Pro rata NOI
    Q2 2024

    Avg.
    Occupancy Q2 2025

    Avg.
    Occupancy Q2 2024

    Renewal
    Success
    Rate Q2
    2025

    Renewal % increase Q2 2025

    Dock 79 Anacostia DC

    305

    $

    995,000

    $

    932,000

    95.5

    %

    93.6

    %

    74.6

    %

    5.9

    %

    Maren Anacostia DC

    264

    $

    890,000

    $

    923,000

    93.6

    %

    94.8

    %

    55.3

    %

    3.2

    %

    Riverside Greenville

    200

    $

    215,000

    $

    215,000

    92.9

    %

    93.0

    %

    65.8

    %

    6.3

    %

    Bryant Street DC

    487

    $

    1,542,000

    $

    1,555,000

    94.6

    %

    91.2

    %

    56.3

    %

    2.1

    %

    .408 Jackson Greenville

    227

    $

    362,000

    $

    345,000

    94.3

    %

    96.2

    %

    52.2

    %

    4.7

    %

    Verge Anacostia DC

    344

    $

    733,000

    $

    710,000

    93.3

    %

    91.3

    %

    63.3

    %

    2.0

    %

    Multifamily Segment

    1,827

    $

    4,737,000

    $

    4,680,000

    94.1

    %

    93.0

    %

    Multifamily Segment (Consolidated – Dock 79 & The Maren)

    Three months ended June 30

    (dollars in thousands)

    2025

    %

    2024

    %

    Change

    %

    Lease revenue

    $

    5,567

    100.0

    %

    5,496

    100.0

    %

    71

    1.3

    %

    Depreciation and amortization

    1,935

    34.8

    %

    1,981

    36.1

    %

    (46

    )

    -2.3

    %

    Operating expenses

    1,527

    27.4

    %

    1,519

    27.6

    %

    8

    .5

    %

    Property taxes

    648

    11.6

    %

    576

    10.5

    %

    72

    12.5

    %

    Cost of operations

    4,110

    73.8

    %

    4,076

    74.2

    %

    34

    .8

    %

    Operating profit before G&A

    $

    1,457

    26.2

    %

    1,420

    25.8

    %

    37

    2.6

    %

    Total revenues for our two consolidated joint ventures were $5,567,000, an increase of $71,000 versus $5,496,000 in the same period last year. Total operating profit before G&A for the consolidated joint ventures was $1,457,000, an increase of $37,000, or 3% versus $1,420,000 in the same period last year primarily due to lower depreciation.

    Multifamily Segment (Pro rata unconsolidated)

    Our Multifamily Segment has four unconsolidated joint ventures (Bryant Street, The Verge, Riverside, and .408 Jackson). Riverside was moved from the Development segment to the Multifamily segment in 2022, Bryant Street and .408 Jackson moved as of the beginning of 2024 and The Verge moved effective July 1, 2024, each upon reaching lease up stabilization.

    Three months ended June 30

    (dollars in thousands)

    2025

    %

    2024

    %

    Change

    %

    Lease revenue

    $

    5,436

    100.0

    %

    5,118

    100.0

    %

    318

    6.2

    %

    Depreciation and amortization

    2,325

    42.8

    %

    2,299

    44.9

    %

    26

    1.1

    %

    Operating expenses

    1,886

    34.7

    %

    1,724

    33.7

    %

    162

    9.4

    %

    Property taxes

    654

    12.0

    %

    599

    11.7

    %

    55

    9.2

    %

    Cost of operations

    4,865

    89.5

    %

    4,622

    90.3

    %

    243

    5.3

    %

    Operating profit before G&A

    $

    571

    10.5

    %

    496

    9.7

    %

    75

    15.1

    %

    For our four unconsolidated joint ventures, pro rata revenues were $5,436,000, an increase of $318,000 or 6% compared to $5,118,000 in the same period last year. Pro rata operating profit before G&A was $571,000, an increase of $75,000 or 15% versus $496,000 in the same period last year. The increase was due to improved occupancy at The Verge and Bryant Street and higher revenues at .408 Jackson.

    Industrial and Commercial Segment

    Three months ended June 30

    (dollars in thousands)

    2025

    %

    2024

    %

    Change

    %

    Lease revenue

    $

    1,374

    100.0

    %

    1,445

    100.0

    %

    (71

    )

    (4.9

    %)

    Depreciation and amortization

    571

    41.6

    %

    360

    25.0

    %

    211

    58.6

    %

    Operating expenses

    230

    16.7

    %

    191

    13.2

    %

    39

    20.4

    %

    Property taxes

    130

    9.5

    %

    64

    4.4

    %

    66

    103.1

    %

    Cost of operations

    931

    67.8

    %

    615

    42.6

    %

    316

    51.4

    %

    Operating profit before G&A

    $

    443

    32.2

    %

    830

    57.4

    %

    (387

    )

    (46.6

    %)

    Depreciation and amortization

    571

    360

    211

    Unrealized revenues

    (4

    )

    (3

    )

    (1

    )

    Net operating income

    $

    1,010

    73.5

    %

    $

    1,187

    82.1

    %

    $

    (177

    )

    (14.9

    %)

    Shell construction on our 258,279 square foot spec warehouse project in Aberdeen, MD on Chelsea Road was completed effective April 1, 2025 and is in the lease-up phase. We have ten buildings in service at four different locations totaling 773,356 square feet of industrial and 33,708 square feet of office of which 50.3% was leased and occupied at June 30, 2025. Excluding Chelsea these assets were 74.0% leased and occupied during the quarter compared to 95.6% leased and occupied during the same quarter last year primarily due to an eviction for failure to pay rent by one tenant and lease expirations. Total revenues in this segment were $1,374,000, down $71,000 or 5%, over the same period last year. Operating profit before G&A was $443,000, down $387,000 or 47% over the same quarter last year due to $216,000 of depreciation and $30,000 of operating costs at Chelsea along with the lower occupancy. Net operating income in this segment was $1,010,000, down $177,000 or 15% compared to the same quarter last year.

    Mining Royalty Lands Segment Results

    Three months ended June 30

    (dollars in thousands)

    2025

    %

    2024

    %

    Change

    %

    Mining royalty and rent revenue

    $

    3,609

    100.0

    %

    3,231

    100.0

    %

    378

    11.7

    %

    Depreciation, depletion and amortization

    177

    5.0

    %

    159

    4.9

    %

    18

    11.3

    %

    Operating expenses

    16

    0.4

    %

    16

    0.5

    %

    %

    Property taxes

    76

    2.1

    %

    71

    2.2

    %

    5

    7.0

    %

    Cost of operations

    269

    7.5

    %

    246

    7.6

    %

    23

    9.3

    %

    Operating profit before G&A

    $

    3,340

    92.5

    %

    2,985

    92.4

    %

    355

    11.9

    %

    Depreciation and amortization

    177

    159

    18

    Unrealized revenues

    148

    (116

    )

    264

    Net operating income

    $

    3,665

    101.6

    %

    $

    3,028

    93.7

    %

    $

    637

    21.0

    %

    Total revenues in this segment were $3,609,000, an increase of $378,000 or 12% versus $3,231,000 in the same period last year. Royalty revenues in the prior year were impacted by the deduction of $277,000 of royalties to resolve an overpayment which we referenced previously. Royalty tons were down 3% primarily due to a decrease at one location that experienced a project specific spike in demand in the prior year. Royalty revenue per ton increased 7% over the same period last year excluding the prior year overpayment deduction. Total operating profit before G&A in this segment was $3,340,000, an increase of $355,000 versus $2,985,000 in the same period last year. Net operating income was $3,665,000, up $637,000 or 21% compared to the same quarter last year due to the higher revenues and a $264,000 decrease in unrealized revenues. The unrealized revenue decrease is due to the temporarily higher minimum royalty payments we are currently receiving at one location which are straight-lined across the life of the lease for GAAP revenue purposes.

    Development Segment Results

    Three months ended June 30

    (dollars in thousands)

    2025

    2024

    Change

    Lease revenue

    $

    300

    305

    (5

    )

    Depreciation, depletion and amortization

    43

    43

    Operating expenses

    807

    (24

    )

    831

    Property taxes

    148

    149

    (1

    )

    Cost of operations

    998

    168

    830

    Operating profit before G&A

    $

    (698

    )

    137

    (835

    )

    With respect to ongoing Development Segment projects:

    • We are the principal capital source to develop 344 residential lots on 110 acres in Harford County, MD. We have funded $27.0 million of our $31.1 million total commitment. A national homebuilder is under contract to purchase all 222 townhome lots and 122 single family lots. At quarter-end, 160 lots have been sold and $22.2 million has been returned to the company of which $5.5 million was booked as profit to the Company.

    • We entered into two new joint venture agreements in early 2024 with Altman Logistics. The first joint venture is a 201,420 square-foot warehouse development project in Lakeland, FL, and the second joint venture is a two building 183,215 square-foot warehouse redevelopment project in Broward County, FL. We closed on both construction loans in March, 2025 and construction commenced in the second quarter of 2025.

    • On May 30, 2025, we secured construction financing for our multifamily joint venture with Woodfield Development, known as Woven. This is our third multifamily project in Greenville, SC. This is an $87.8M project with 214 units and 13,500 square feet of ground floor retail that is eligible to receive South Carolina Textile Rehabilitation Credits upon substantial completion and received Special Source Credits equal to 50% of the real estate taxes for a period of 20 years.

    • On June 16, 2025, our BC Realty partnership refinanced our FRP provided floating rate construction loans on our two (2) office buildings with Symetra Life Insurance Company. This is a 10-year, fully amortizing $10.5M permanent loan, at a fixed interest rate of 6.40%.

    Six Month Highlights

    • 32% decrease in Net Income ($2.3 million vs $3.3 million)

    • 7% increase in pro rata NOI ($19.1 million vs $17.8 million)

    • 2% increase in the Multifamily segment’s pro rata NOI primarily due to lease up of The Verge. This comparison includes the results for this project from the same period last year (when this project was still in our Development segment).

    • 6% decrease in Industrial and Commercial revenue and 8% decrease in that segment’s NOI

    • 20.1% increase in the Mining Royalty Lands’ segment’s NOI

    Comparative Results of Operations for the Six months ended June 30, 2025 and 2024

    Consolidated Results

    (dollars in thousands)

    Six Months Ended June 30,

    2025

    2024

    Change

    %

    Revenues:
    Lease revenue

    $

    14,313

    14,416

    $

    (103

    )

    -.7

    %

    Mining royalty and rents

    6,843

    6,194

    649

    10.5

    %

    Total revenues

    21,156

    20,610

    546

    2.6

    %

    Cost of operations:
    Depreciation/depletion/amortization

    5,333

    5,078

    255

    5.0

    %

    Operating expenses

    4,439

    3,569

    870

    24.4

    %

    Property taxes

    1,940

    1,667

    273

    16.4

    %

    General and administrative

    5,462

    4,594

    868

    18.9

    %

    Total cost of operations

    17,174

    14,908

    2,266

    15.2

    %

    Total operating profit

    3,982

    5,702

    (1,720

    )

    -30.2

    %

    Net investment income

    4,909

    6,491

    (1,582

    )

    -24.4

    %

    Interest expense

    (1,519

    )

    (1,740

    )

    221

    -12.7

    %

    Equity in loss of joint ventures

    (4,410

    )

    (5,743

    )

    1,333

    -23.2

    %

    Income before income taxes

    2,962

    4,710

    (1,748

    )

    -37.1

    %

    Provision for income taxes

    704

    1,316

    (612

    )

    -46.5

    %

    Net income

    2,258

    3,394

    (1,136

    )

    -33.5

    %

    Income (loss) attributable to noncontrolling interest

    (30

    )

    49

    (79

    )

    -161.2

    %

    Net income attributable to the Company

    $

    2,288

    $

    3,345

    $

    (1,057

    )

    -31.6

    %

    Net income for the first six months of 2025 was $2,288,000 or $.12 per share versus $3,345,000 or $.18 per share in the same period last year. Pro rata NOI for the first six months of 2025 was $19,052,000 versus $17,764,000 in the same period last year. The first six months of 2025 were impacted by the following items:

    • Operating profit decreased $1,720,000 primarily due to higher Development segment professional fees ($682,000) and higher General and administrative expense ($868,000). Development segment professional fees included $712,000 of legal expenses related to due diligence for a potential investment the company is evaluating. General and administrative expense increased primarily due to overlapping compensation as a result of the implementation of our executive succession and transition plan that commenced in June, 2024. Industrial and commercial segment operating profit declined $556,000 because of a $211,000 increase in depreciation expense from completion of our new Chelsea warehouse, as well as lower occupancy due to a tenant default and non-renewing leases. Mining Royalty Land’s segment operating profit increased $596,000 primarily because of the prior year’s overpayment deduction of $566,000.

    • Net investment income decreased $1,582,000 from reduced earnings on cash equivalents ($904,000) and reduced income from our lending ventures ($678,000) primarily due to fewer residential lot sales.

    • Interest expense decreased $221,000 compared to the same period last year as we capitalized $209,000 more interest. More interest was capitalized due to increased in-house and joint venture projects under development this quarter compared to last year.

    • Equity in loss of Joint Ventures improved $1,333,000 because of improved results at our unconsolidated joint ventures. Results improved at The Verge ($499,000) due to lease up, and also at Bryant Street ($656,000) and BC Realty ($222,000) because of higher revenues and lower variable rate interest expense.

    Multifamily Segment (Pro rata consolidated and pro rata unconsolidated)

    For ease of comparison all the figures in the tables below include the results for The Verge from prior periods (when this project was still in our Development segment).

    Six months ended June 30

    (dollars in thousands)

    2025

    %

    2024

    %

    Change

    %

    Lease revenue

    $

    16,772

    100.0

    %

    15,996

    100.0

    %

    776

    4.9

    %

    Depreciation and amortization

    6,673

    39.8

    %

    6,689

    41.8

    %

    (16

    )

    -.2

    %

    Operating expenses

    5,316

    31.7

    %

    5,072

    31.7

    %

    244

    4.8

    %

    Property taxes

    1,978

    11.8

    %

    1,801

    11.3

    %

    177

    9.8

    %

    Cost of operations

    13,967

    83.3

    %

    13,562

    84.8

    %

    405

    3.0

    %

    Operating profit before G&A

    $

    2,805

    16.7

    %

    2,434

    15.2

    %

    371

    15.2

    %

    Depreciation and amortization

    6,673

    6,689

    (16

    )

    Unrealized rents & other

    (111

    )

    46

    (157

    )

    Net operating income

    $

    9,367

    55.8

    %

    9,169

    57.3

    %

    198

    2.2

    %

    The combined consolidated and unconsolidated pro rata net operating income this quarter for this segment was $9,367,000, up $198,000 or 2% compared to $9,169,000 in the same period last year. Most of this increase was from the lease up of The Verge which contributed $1,486,000 of pro rata NOI to this segment compared to $1,316,000 in the Development segment in the same period last year, an increase of $170,000. Same store NOI increased $28,000.

    Apartment Building

    Units

    Pro rata NOI
    YTD 2025
    Pro rata NOI
    YTD 2024

    Avg.
    Occupancy
    YTD 2025

    Avg.
    Occupancy
    YTD 2024

    Renewal
    Success
    Rate YTD
    2025

    Renewal % increase
    YTD 2025

    Dock 79 Anacostia DC

    305

    $

    1,900,000

    $

    1,878,000

    95.6

    %

    94.2

    %

    70.4

    %

    4.8

    %

    Maren Anacostia DC

    264

    $

    1,745,000

    $

    1,847,000

    93.7

    %

    94.3

    %

    54.0

    %

    4.9

    %

    Riverside Greenville

    200

    $

    437,000

    $

    439,000

    92.9

    %

    93.3

    %

    56.8

    %

    5.0

    %

    Bryant Street DC

    487

    $

    3,081,000

    $

    3,051,000

    93.5

    %

    92.0

    %

    51.8

    %

    2.1

    %

    .408 Jackson Greenville

    227

    $

    718,000

    $

    638,000

    96.1

    %

    94.6

    %

    58.8

    %

    4.6

    %

    Verge Anacostia DC

    344

    $

    1,486,000

    $

    1,316,000

    93.4

    %

    89.5

    %

    69.1

    %

    2.8

    %

    Multifamily Segment

    1,827

    $

    9,367,000

    $

    9,169,000

    94.1

    %

    92.7

    %

    Multifamily Segment (Consolidated – Dock 79 and The Maren)

    Six months ended June 30

    (dollars in thousands)

    2025

    %

    2024

    %

    Change

    %

    Lease revenue

    $

    10,991

    100.0

    %

    10,910

    100.0

    %

    81

    .7

    %

    Depreciation and amortization

    3,930

    35.7

    %

    3,962

    36.3

    %

    (32

    )

    -.8

    %

    Operating expenses

    3,112

    28.3

    %

    2,980

    27.3

    %

    132

    4.4

    %

    Property taxes

    1,283

    11.7

    %

    1,100

    10.1

    %

    183

    16.6

    %

    Cost of operations

    8,325

    75.7

    %

    8,042

    73.7

    %

    283

    3.5

    %

    Operating profit before G&A

    $

    2,666

    24.3

    %

    2,868

    26.3

    %

    (202

    )

    -7.0

    %

    Total revenues for our two consolidated joint ventures were $10,991,000, an increase of $81,000 versus $10,910,000 in the same period last year. Total operating profit before G&A for the consolidated joint ventures was $2,666,000, a decrease of $202,000, or 7% versus $2,868,000 in the same period last year primarily due to higher operating expenses ($132,000) and property taxes ($183,000).

    Multifamily Segment (Pro rata unconsolidated)

    Our Multifamily Segment has four unconsolidated joint ventures (Bryant Street, The Verge, Riverside, and .408 Jackson). Riverside was moved from the Development segment to the Multifamily segment in 2022, Bryant Street and .408 Jackson moved as of the beginning of 2024 and The Verge moved effective July 1, 2024, each upon reaching lease up stabilization.

    Six months ended June 30

    (dollars in thousands)

    2025

    %

    2024

    %

    Change

    %

    Lease revenue

    $

    10,785

    100.0

    %

    10,051

    100.0

    %

    734

    7.3

    %

    Depreciation and amortization

    4,518

    41.9

    %

    4,518

    45.0

    %

    %

    Operating expenses

    3,666

    34.0

    %

    3,452

    34.3

    %

    214

    6.2

    %

    Property taxes

    1,279

    11.9

    %

    1,204

    12.0

    %

    75

    6.2

    %

    Cost of operations

    9,463

    87.7

    %

    9,174

    91.3

    %

    289

    3.2

    %

    Operating profit

    $

    1,322

    12.3

    %

    877

    8.7

    %

    445

    50.7

    %

    For our four unconsolidated joint ventures, pro rata revenues were $10,785,000, an increase of $734,000 or 7% compared to $10,051,000 in the same period last year. Pro rata operating profit before G&A was $1,322,000, an increase of $445,000, or 51% versus $877,000 in the same period last year. The increase was due to lease up at The Verge and higher revenues at Bryant Street and .408 Jackson.

    Industrial and Commercial Segment

    Six months ended June 30

    (dollars in thousands)

    2025

    %

    2024

    %

    Change

    %

    Lease revenue

    $

    2,721

    100.0

    %

    2,898

    100.0

    %

    (177

    )

    (6.1

    %)

    Depreciation and amortization

    962

    35.4

    %

    723

    24.9

    %

    239

    33.1

    %

    Operating expenses

    463

    17.0

    %

    406

    14.0

    %

    57

    14.0

    %

    Property taxes

    210

    7.7

    %

    127

    4.4

    %

    83

    65.4

    %

    Cost of operations

    1,635

    60.1

    %

    1,256

    43.3

    %

    379

    30.2

    %

    Operating profit before G&A

    $

    1,086

    39.9

    %

    1,642

    56.7

    %

    (556

    )

    (33.9

    %)

    Depreciation and amortization

    962

    723

    239

    Unrealized revenues

    101

    (19

    )

    120

    Net operating income

    $

    2,149

    79.0

    %

    $

    2,346

    81.0

    %

    $

    (197

    )

    (8.4

    %)

    Total revenues in this segment were $2,721,000, down $177,000 or 6%, over the same period last year. Operating profit before G&A was $1,086,000, down $556,000 or 34% from $1,642,000 in the same period last year due to $216,000 of depreciation and $30,000 of operating costs at our spec Chelsea warehouse placed in service in April, a write-off of $118,000 unrealized rent receivable and $34,000 deferred leasing commission related to a tenant that defaulted, and the related lower occupancy. Net operating income in this segment was $2,149,000, down $197,000 or 8% compared to the same period last year.

    Mining Royalty Lands Segment Results

    Six months ended June 30

    (dollars in thousands)

    2025

    %

    2024

    %

    Change

    %

    Mining royalty and rent revenue

    $

    6,843

    100.0

    %

    6,194

    100.0

    %

    649

    10.5

    %

    Depreciation, depletion and amortization

    355

    5.2

    %

    308

    5.0

    %

    47

    15.3

    %

    Operating expenses

    32

    0.5

    %

    33

    0.5

    %

    (1

    )

    -3.0

    Property taxes

    151

    2.2

    %

    144

    2.3

    %

    7

    4.9

    %

    Cost of operations

    538

    7.9

    %

    485

    7.8

    %

    53

    10.9

    %

    Operating profit before G&A

    $

    6,305

    92.1

    %

    5,709

    92.2

    %

    596

    10.4

    %

    Depreciation and amortization

    355

    308

    47

    Unrealized revenues

    289

    (229

    )

    518

    Net operating income

    $

    6,949

    101.5

    %

    $

    5,788

    93.4

    %

    $

    1,161

    20.1

    %

    Total revenues in this segment were $6,843,000, an increase of $649,000 or 10% versus $6,194,000 in the same period last year. Royalty revenues in the prior year were impacted by the deduction of royalties to resolve an $842,000 overpayment which we referenced previously. Through the six months of last year, the tenant withheld $566,000 in royalties otherwise due to the Company. Royalty tons were down 7% primarily due to a decrease at one location that had one-time project specific rail shipments in the prior year. The revenue reduction from the decreased volume was more than offset by increased royalties per ton (up 8.5% excluding the prior year payment deduction) along with the overpayment reduction in the prior year. Total operating profit before G&A in this segment was $6,305,000, an increase of $596,000 versus $5,709,000 in the same period last year. Net operating income in this segment was $6,949,000, up $1,161,000 or 20% compared to the same period last year due to higher revenues and a $518,000 increase in unrealized revenues due to temporarily higher minimum royalty payments at one location which are straight-lined across the life of the lease for GAAP revenue purposes.

    Development Segment Results

    Six months ended June 30

    (dollars in thousands)

    2025

    2024

    Change

    Lease revenue

    $

    601

    608

    (7

    )

    Depreciation, depletion and amortization

    86

    85

    1

    Operating expenses

    832

    150

    682

    Property taxes

    296

    296

    Cost of operations

    1,214

    531

    683

    Operating profit before G&A

    $

    (613

    )

    77

    (690

    )

    FRP HOLDINGS, INC. AND SUBSIDIARIES
    CONSOLIDATED BALANCE SHEETS
    (In thousands, except share data)

    Assets:

    June 30
    2025

    December 31
    2024

    Real estate investments at cost:
    Land

    $

    168,927

    168,943

    Buildings and improvements

    308,561

    283,421

    Projects under construction

    16,167

    32,770

    Total investments in properties

    493,655

    485,134

    Less accumulated depreciation and depletion

    82,916

    77,695

    Net investments in properties

    410,739

    407,439

    Real estate held for investment, at cost

    12,312

    11,722

    Investments in joint ventures

    139,098

    153,899

    Net real estate investments

    562,149

    573,060

    Cash and cash equivalents

    153,167

    148,620

    Cash held in escrow

    1,266

    1,315

    Accounts receivable, net

    1,586

    1,352

    Federal and state income taxes receivable

    778

    Unrealized rents

    1,264

    1,380

    Deferred costs

    1,942

    2,136

    Other assets

    630

    622

    Total assets

    $

    722,782

    728,485

    Liabilities:
    Secured notes payable

    $

    180,371

    178,853

    Accounts payable and accrued liabilities

    6,739

    6,026

    Other liabilities

    1,487

    1,487

    Federal and state income taxes payable

    611

    Deferred revenue

    2,842

    2,437

    Deferred income taxes

    67,655

    67,688

    Deferred compensation

    1,494

    1,465

    Tenant security deposits

    780

    805

    Total liabilities

    261,368

    259,372

    Commitments and contingencies
    Equity:
    Common stock, $.10 par value 25,000,000 shares authorized, 19,109,234 and 19,046,894 shares issued and outstanding, respectively

    1,911

    1,905

    Capital in excess of par value

    70,196

    68,876

    Retained earnings

    354,555

    352,267

    Accumulated other comprehensive income, net

    40

    55

    Total shareholders’ equity

    426,702

    423,103

    Noncontrolling interests

    34,712

    46,010

    Total equity

    461,414

    469,113

    Total liabilities and equity

    $

    722,782

    728,485

    Non-GAAP Financial Measures.

    To supplement the financial results presented in accordance with GAAP, FRP presents certain non-GAAP financial measures within the meaning of Regulation G promulgated by the Securities and Exchange Commission. We believe these non-GAAP measures provide useful information to our Board of Directors, management and investors regarding certain trends relating to our financial condition and results of operations. Our management uses these non-GAAP measures to compare our performance to that of prior periods for trend analyses, purposes of determining management incentive compensation and budgeting, forecasting and planning purposes. We provide Pro rata net operating income (NOI) because we believe it assists investors and analysts in estimating our economic interest in our consolidated and unconsolidated partnerships, when read in conjunction with our reported results under GAAP. This measure is not, and should not be viewed as, a substitute for GAAP financial measures. For ease of comparison all the figures in the tables below include the results for The Verge in the Multifamily segment for all periods shown.

    Pro rata Net Operating Income Reconciliation
    Six months ending 6/30/25 (in thousands)

    Industrial and
    Commercial
    Segment
    Development
    Segment
    Multifamily
    Segment
    Mining
    Royalties
    Segment
    Unallocated
    Corporate
    Expenses
    FRP
    Holdings
    Totals
    Net income (loss)

    $

    831

    1,086

    (2,531

    )

    4,806

    (1,934

    )

    2,258

    Income tax allocation

    255

    333

    (788

    )

    1,476

    (572

    )

    704

    Income (loss) before income taxes

    1,086

    1,419

    (3,319

    )

    6,282

    (2,506

    )

    2,962

    Less:
    Unrealized rents

    Interest income

    1,876

    1

    3,032

    4,909

    Plus:
    Unrealized rents

    101

    14

    289

    404

    Professional fees

    734

    87

    821

    Equity in loss of joint ventures

    (156

    )

    4,543

    23

    4,410

    Interest expense

    1,443

    76

    1,519

    Depreciation/amortization

    962

    86

    3,930

    355

    5,333

    General and administrative

    5,462

    5,462

    Net operating income (loss)

    2,149

    207

    6,697

    6,949

    16,002

    NOI of noncontrolling interest

    (3,052

    )

    (3,052

    )

    Pro rata NOI from unconsolidated joint ventures

    380

    5,722

    6,102

    Pro rata net operating income

    $

    2,149

    587

    9,367

    6,949

    19,052

    Pro-rata Net Operating Income Reconciliation
    Six months ended 06/30/24 (in thousands)

    Industrial and
    Commercial
    Segment
    Development
    Segment
    Multifamily
    Segment
    Mining
    Royalties
    Segment
    Unallocated
    Corporate
    Expenses
    FRP
    Holdings
    Totals
    Net income (loss)

    $

    805

    (1,115

    )

    (2,477

    )

    3,876

    2,305

    3,394

    Income tax allocation

    247

    (343

    )

    (772

    )

    1,191

    993

    1,316

    Income (loss) before income taxes

    1,052

    (1,458

    )

    (3,249

    )

    5,067

    3,298

    4,710

    Less:
    Unrealized rents

    19

    9

    229

    257

    Interest income

    2,554

    3,937

    6,491

    Plus:

    Professional fees

    15

    15

    Equity in loss of joint ventures

    1,782

    3,939

    22

    5,743

    Interest expense

    1,652

    88

    1,740

    Depreciation/amortization

    723

    85

    3,962

    308

    5,078

    General and administrative

    590

    2,307

    526

    620

    551

    4,594

    Net operating income (loss)

    2,346

    162

    6,836

    5,788

    15,132

    NOI of noncontrolling interest

    (3,111

    )

    (3,111

    )

    Pro-rata NOI from unconsolidated joint ventures

    299

    5,444

    5,743

    Pro-rata net operating income

    $

    2,346

    461

    9,169

    5,788

    17,764

    Conference Call

    The Company will host a conference call on Thursday, August 7, 2025 at 9:00 a.m. (EDT). Analysts, stockholders and other interested parties may access the teleconference live by calling 1-800-343-4849 (passcode 83364) within the United States. International callers may dial 1-203-518-9848 (passcode 83364). Audio replay will be available until August 21, 2025 by dialing 1-800-839-2385 within the United States. International callers may dial 1-402-220-7203. No passcode needed. An audio replay will also be available on the Company’s website under investors, financials, quarterly results (https://investors.frpdev.com/quarterly-reports) following the call.

    Additional Information

    Our investor relations website is https://investors.frpdev.com and we encourage investors to use it as a way of easily finding information about us. We promptly make available on this website, free of charge, the reports that we file or furnish with the SEC, press releases, quarterly earnings presentations, investor presentations, and corporate governance information, which may contain material information about us, and you may subscribe to Email Alerts to be notified of new information posted to this site.

    Investors are cautioned that any statements in this press release which relate to the future are, by their nature, subject to risks and uncertainties that could cause actual results and events to differ materially from those indicated in such forward-looking statements. These include, but are not limited to: the possibility that we may be unable to find appropriate investment opportunities; levels of construction activity in the markets served by our mining properties; demand for flexible warehouse/office facilities in the MidAtlantic and Florida; multifamily demand in Washington D.C. and Greenville, South Carolina; our ability to obtain zoning and entitlements necessary for property development; the impact of lending and capital market conditions on our liquidity; our ability to finance projects or repay our debt; general real estate investment and development risks; vacancies in our properties; risks associated with developing and managing properties in partnership with others; competition; our ability to renew leases or re-lease spaces as leases expire; illiquidity of real estate investments; bankruptcy or defaults of tenants; the impact of restrictions imposed by our credit facility; the level and volatility of interest rates; environmental liabilities; inflation risks; cybersecurity risks; as the impact of tariffs on our industrial tenants and construction costs; well as other risks listed from time to time in our SEC filings; including but not limited to; our annual and quarterly reports. We have no obligation to revise or update any forward-looking statements, other than as imposed by law, as a result of future events or new information. Readers are cautioned not to place undue reliance on such forward-looking statements.

    FRP Holdings, Inc. is a holding company engaged in the real estate business, namely (i) leasing and management of commercial properties owned by the Company, (ii) leasing and management of mining royalty land owned by the Company, (iii) real property acquisition, entitlement, development and construction primarily for apartment, retail, warehouse, and office, and (iv) leasing and management of residential apartment buildings.

    Contact:

    Matthew C. McNulty
    Chief Financial Officer
    (904) 858-9100

    SOURCE: FRP Holdings, Inc.

    View the original press release on ACCESS Newswire

    The post FRP Holdings, Inc. Reports Fiscal 2025 Second Quarter Results appeared first on Local News Hub.

  • Protagonist Reports Second Quarter 2025 Financial Results and Provides Corporate Update

    Protagonist Reports Second Quarter 2025 Financial Results and Provides Corporate Update

    NDA for icotrokinra for the treatment of adults and adolescents 12 years of age and older with moderate to severe plaque psoriasis (PsO) submitted to U.S. FDA in July

    ANTHEM Phase 2b trial data of icotrokinra in ulcerative colitis scheduled for an oral presentation at the 33rd United European Gastroenterology Week (UEGW) on October 7th

    Phase 3 VERIFY trial data set of rusfertide in polycythemia vera (PV) presented during plenary session at ASCO; U.S. NDA filing on track for Q4

    Cash, cash equivalents and marketable securities of $673.0 million as of June 30, 2025, anticipated to provide cash runway through at least end of 2028

    NEWARK, CA / ACCESS Newswire / August 6, 2025 / Protagonist Therapeutics (Nasdaq:PTGX) (“Protagonist” or “the Company”) today reported financial results for the second quarter ended June 30, 2025, and provided a corporate update.

    “Thus far, 2025 has been a year of breakthrough accomplishments for Protagonist, as we saw rusfertide the topic of the prestigious ASCO Plenary Session in May, the announcement of an oral and injectable triple agonist anti-obesity peptide development candidate in June, and most recently the first ever NDA filing of icotrokinra for psoriasis last month,” said Dinesh V. Patel, Ph.D., the Company’s President and CEO. “Over the coming months, we look forward to the NDA filing of rusfertide for polycythemia vera, and advancing our wholly owned early-stage assets PN-881 and PN-477 into clinical and IND-enabling studies respectively.”

    Second Quarter 2025 Recent Developments and Upcoming Milestones

    Rusfertide: Subcutaneous Injectable Hepcidin Mimetic for Polycythemia Vera (PV) and Other Blood Disorders

    • The full data set from the positive Phase 3 VERIFY trial of rusfertide in PV was presented during the prestigious plenary session at the 2025 American Society of Clinical Oncology (ASCO) Annual Meeting on Sunday, June 1st.

    • The Company hosted an investor conference call on Monday, June 2nd discussing data shared during the plenary presentation. A replay of the call and accompanying presentation is available on the Company’s Investor Relations Events and Presentations webpage here.

    • Rusfertide U.S. NDA filing for treatment of patients with PV, by partner Takeda Pharmaceuticals, expected in Q4 of this year.

    Icotrokinra (JNJ-2113): Oral IL-23 Receptor Antagonist

    • On July 21st, the Company and its partner Johnson and Johnson announced the first icotrokinra NDA filing for the treatment of adults and adolescents 12 years of age and older with moderate to severe plaque psoriasis (PsO). The application included data from four pivotal Phase 3 studies conducted as part of the ICONIC clinical development program, including ICONIC-LEAD, ICONIC-TOTAL and ICONIC-ADVANCE 1 & ICONIC-ADVANCE 2.

    • On May 9th, data from the Phase 3 ICONIC-TOTAL study in difficult-to-treat scalp and genital psoriasis was presented at the Society for Investigative Dermatology Annual Meeting held in San Diego from May 7-10th.

      • On April 10th, data from the adolescent cohort of the Phase 3 ICONIC-LEAD study in moderate-to-severe plaque psoriasis was presented as a late-breaking abstract at the 2025 World Congress of Pediatric Dermatology (WCPD).

    • On March 10th, positive top line results from the Phase 2b ANTHEM trial in moderately to severely active ulcerative colitis (UC) were announced. The full data set is scheduled for an oral presentation at the 33rd United European Gastroenterology Week (UEGW) on October 7th.

    Development Pipeline:First-in-Class Oral IL-17 Peptide Antagonist (PN-881) & GLP-1, GIP, & GCG Triple Agonist (PN-477)

    • On June 30th, the Company hosted an investor call announcing the selection of PN-477, a potential best-in-class GLP-1, GIP, GCG receptor triple agonist peptide with oral and subcutaneous routes of administration, as a development candidate for the treatment of obesity. A replay of the call and accompanying presentation is available on the Company’s Investor Relations Events and Presentations webpage here.

    • On May 9th, preclinical data on PN-881 was presented at the Society for Investigative Dermatology (SID) Annual Meeting held in San Diego from May 7-10th. Key takeaways from the pre-clinical characterization of the IL-17 oral peptide antagonist PN-881:

      • Potently and selectively binds IL-17A and -17F, blocking the three dimeric forms of the cytokine.

      • Nanomolar to picomolar in vitro potency comparable to bimekizumab and superior (70-fold) to secukinumab.

      • Metabolic stability in several matrices across several species, making it a suitable candidate for oral delivery.

      • Pharmocodynamic-based target engagement in a mouse IL-17 challenge model after oral dosing.

      • Dose-dependent efficacy with significant reduction in skin thickness in a 5-day rat IL-23 induced skin inflammation model after oral dosing.

    Second Quarter 2025 Financial Results

    • Cash, Cash Equivalents and Marketable Securities: Cash, cash equivalents and marketable securities as of June 30, 2025, were $673.0 million as compared to $559.2 million as of December 31, 2024.

    Three Months Ended

    Six Months Ended

    June 30,

    June 30,

    (in thousands, except per share amounts)

    2025

    2024

    2025

    2024

    (Unaudited)

    License and collaboration revenue

    $

    5,546

    $

    4,167

    $

    33,867

    $

    259,120

    Research and development expense

    $

    37,036

    $

    33,520

    $

    72,929

    $

    67,254

    General and administrative expense

    $

    10,551

    $

    9,440

    $

    22,289

    $

    24,350

    Net (loss) income

    $

    (34,771

    )

    $

    (30,616

    )

    $

    (46,426

    )

    $

    176,724

    Basic (loss) earnings per share

    $

    (0.55)

    $

    (0.50)

    $

    (0.73)

    $

    2.89

    Diluted (loss) earnings per share

    $

    (0.55)

    $

    (0.50)

    $

    (0.73)

    $

    2.77

    • License and Collaboration Revenue:

      • License and collaboration revenue of $5.5 million and $4.2 million for the second quarter of 2025 and 2024, respectively, was comprised of development services we provided under the Takeda collaboration agreement.

      • License and collaboration revenue of $33.9 million for the six months ended June 30, 2025 was comprised of (i) proportional recognition of a $25 million milestone earned from Takeda in Q1 25, and (ii) development services we provided during the period. License and collaboration revenue of $259.1 million for the six months ended June 30, 2024 included (i) $254.1 million of the $300.0 million initial transaction price for the Takeda collaboration agreement allocated to the rusfertide license upon effectiveness of the agreement, and (ii) development services we provided during the period.

    • Research and Development (“R&D”) Expense: The increases in R&D expense from the prior year periods were primarily due to increases in pre-clinical and drug discovery research expenses, including costs related to our new product candidates, IL-17 oral peptide antagonist PN-881 and obesity triple agonist peptide PN-477, partially offset by decreases in rusfertide expenses related to the Phase 3 VERIFY clinical trial.

    • General and Administrative (“G&A”) Expense: The increase in G&A expense for the second quarter of 2025 from the prior year period was primarily due to increases in stock-based compensation and other personnel-related expenses. The decrease in G&A expense for the six months ended June 30, 2025 from the prior year period was primarily due to $4.6 million in advisory and legal fees recognized in 2024 related to the Takeda collaboration, partially offset by increases in stock-based compensation expense and other personnel-related expenses.

    • Net (Loss) Income: Net loss was $34.8 million, or $0.55 per basic and diluted share, for the second quarter of 2025 as compared to net loss of $30.6 million, or $0.50 per basic and diluted share, for the second quarter of 2024. Net loss was $46.4 million, or $0.73 per basic and diluted share, for the six months ended June 30, 2025 as compared to net income of $176.7 million, or $2.89 per basic share and $2.77 per diluted share, for the six months ended June 30, 2024, which included recognition of $259.1 million revenue related to the Takeda collaboration agreement upfront payment of $300.0 million.

    About Protagonist

    Protagonist Therapeutics is a discovery through late-stage development biopharmaceutical company. Two novel peptides derived from Protagonist’s proprietary discovery platform are currently in advanced Phase 3 clinical development, with a New Drug Application (NDA) for icotrokinra submitted to the FDA in July and an NDA submission for rusfertide expected by end of 2025. Icotrokinra (formerly, JNJ-2113), a first-in-class investigational targeted oral peptide that selectively blocks the Interleukin-23 receptor (“IL-23R”) is licensed to J&J Innovative Medicines (“JNJ”), formerly Janssen Biotech, Inc. Following icotrokinra’s joint discovery by Protagonist and JNJ scientists pursuant to the companies’ IL-23R collaboration, Protagonist was primarily responsible for development of icotrokinra through Phase 1, with JNJ assuming responsibility for development in Phase 2 and beyond. Rusfertide, a mimetic of the natural hormone hepcidin, is currently in Phase 3 development for the rare blood disorder polycythemia vera (PV). Rusfertide is being co-developed and will be co-commercialized with Takeda Pharmaceuticals pursuant to a worldwide collaboration and license agreement entered in 2024 under which the Company remains primarily responsible for development through NDA filing. The Company also has a number of pre-clinical stage drug discovery programs addressing biologically and commercially validated targets, including IL-17 oral peptide antagonist PN-881, obesity triple agonist peptide PN-477, and the oral hepcidin program.

    More information on Protagonist, its pipeline drug candidates and clinical studies can be found on the Company’s website at https://www.protagonist-inc.com/.

    Cautionary Note on Forward-Looking Statements

    This press release contains forward-looking statements for purposes of the safe harbor provisions of the Private Securities Litigation Reform Act of 1995. Forward-looking statements include statements regarding the potential benefits of icotrokinra and rusfertide, the timing of icotrokinra and rusfertide clinical trials, and timing of developments and announcements in our discovery programs. In some cases, you can identify these statements by forward-looking words such as “anticipate,” “believe,” “may,” “will,” “expect,” or the negative or plural of these words or similar expressions. Forward-looking statements are not guarantees of future performance and are subject to risks and uncertainties that could cause actual results and events to differ materially from those anticipated, including, but not limited to, our ability to develop and commercialize our product candidates, our ability to earn milestone payments under our collaboration agreements with Janssen and Takeda, our ability to use and expand our programs to build a pipeline of product candidates, our ability to obtain and maintain regulatory approval of our product candidates, our ability to operate in a competitive industry and compete successfully against competitors that have greater resources than we do, and our ability to obtain and adequately protect intellectual property rights for our product candidates. Additional information concerning these and other risk factors affecting our business can be found in our periodic filings with the Securities and Exchange Commission, including under the heading “Risk Factors” contained in our most recently filed periodic reports on Form 10-K and Form 10-Q filed with the Securities and Exchange Commission. Forward-looking statements are not guarantees of future performance, and our actual results of operations, financial condition and liquidity, and the development of the industry in which we operate, may differ materially from the forward-looking statements contained in this press release. Any forward-looking statements that we make in this press release speak only as of the date of this press release. We assume no obligation to update our forward-looking statements, whether as a result of new information, future events or otherwise, after the date of this press release.

    Investor Relations Contact

    Corey Davis, Ph.D.
    LifeSci Advisors
    cdavis@lifesciadvisors.com
    +1 212 915 2577

    Media Relations Contact

    Virginia Amann
    ENTENTE Network of Companies
    virginiaamann@ententeinc.com
    +1 833 500 0061 ext 1

    PROTAGONIST THERAPEUTICS, INC.
    Condensed Consolidated Statements of Operations
    (Unaudited)
    (Amounts in thousands except share and per share data)

    Three Months Ended

    Six Months Ended

    June 30,

    June 30,

    2025

    2024

    2025

    2024

    License and collaboration revenue

    $

    5,546

    $

    4,167

    $

    33,867

    $

    259,120

    Operating expense:
    Research and development (1)

    37,036

    33,520

    72,929

    67,254

    General and administrative (1)

    10,551

    9,440

    22,289

    24,350

    Total operating expense

    47,587

    42,960

    95,218

    91,604

    (Loss) income from operations

    (42,041

    )

    (38,793

    )

    (61,351

    )

    167,516

    Interest income

    7,406

    7,404

    14,979

    11,780

    Other income, net

    36

    97

    118

    78

    (Loss) income before income tax expense (benefit)

    (34,599

    )

    (31,292

    )

    (46,254

    )

    179,374

    Income tax expense (benefit)

    172

    (676

    )

    172

    2,650

    Net (loss) income

    $

    (34,771

    )

    $

    (30,616

    )

    $

    (46,426

    )

    $

    176,724

    Net (loss) income per share, basic

    $

    (0.55

    )

    $

    (0.50

    )

    $

    (0.73

    )

    $

    2.89

    Net (loss) income per share, diluted

    $

    (0.55

    )

    $

    (0.50

    )

    $

    (0.73

    )

    $

    2.77

    Weighted-average shares used to compute net (loss) income per share, basic

    63,510,537

    61,305,289

    63,238,682

    61,080,489

    Weighted-average shares used to compute net (loss) income per share, diluted

    63,510,537

    61,305,289

    63,238,682

    63,909,633

    (1) Amount includes non-cash stock-based compensation expense.

    Stock-based Compensation
    (Unaudited, in thousands)

    Three Months Ended

    Six Months Ended

    June 30,

    June 30,

    2025

    2024

    2025

    2024

    Research and development

    $

    6,291

    $

    5,097

    $

    14,282

    $

    10,385

    General and administrative

    4,621

    3,847

    10,432

    7,911

    Total stock-based compensation expense

    $

    10,912

    $

    8,944

    $

    24,714

    $

    18,296

    PROTAGONIST THERAPEUTICS, INC.
    Selected Condensed Consolidated Balance Sheet Data
    (Unaudited, In thousands)

    June 30,

    December 31,

    2025

    2024

    Cash, cash equivalents and marketable securities$

    672,958

    $

    559,165

    Working capital

    567,019

    544,243

    Total assets

    718,006

    744,725

    Deferred revenue

    20,063

    30,567

    Accumulated deficit

    (386,948

    )

    (340,522

    )

    Total stockholders’ equity

    668,018

    675,295

    SOURCE: Protagonist Therapeutics

    View the original press release on ACCESS Newswire

    The post Protagonist Reports Second Quarter 2025 Financial Results and Provides Corporate Update appeared first on Local News Hub.

  • Avel eCare Hosts National Emergency Airway Course to Sharpen Life-Saving Intubation Skills

    Avel eCare Hosts National Emergency Airway Course to Sharpen Life-Saving Intubation Skills

    90+ medical professionals gather in Sioux Falls for hands-on training, real-time telemedicine support, and continuing education through AVELearn

    SIOUX FALLS, SD / ACCESS Newswire / August 6, 2025 / Over 90 medical professionals from across the country gathered in Sioux Falls for the 2025 Avel eCare Emergency Airway Training Program, powered by The Difficult Airway Course™. This immersive, two-day program combined classroom instruction with high-impact, hands-on practice to help clinicians build confidence and precision in one of the most critical emergency procedures-intubation.

    A standout feature of the course was the use of over 100 porcine tracheas, allowing participants to practice surgical and video-guided airway techniques on a wide variety of anatomies. These real tracheas replicate the diverse challenges clinicians face in real-world airway emergencies, helping providers build muscle memory and quick-response capability.

    “Every airway is different, and every second matters,” said Dr. Kelly Rhone, Chief Medical Officer at Avel eCare. “This course gives physicians the repetition and exposure they need to act decisively and safely when it counts.”

    The training also highlighted Avel’s real-time telemedicine support, including the use of video laryngoscopes-specialized tools with mounted cameras. These allow remote Avel physicians to see exactly what on-site providers see during a live intubation and verbally guide them step-by-step.

    “It’s not just about teaching intubation,” added Dr. Rhone. “It’s about being there-virtually-during the most critical seconds, helping physicians feel confident, supported, and prepared.”

    For some, the impact of the course has already been felt in the field.

    “I had to perform a surgical cricothyrotomy for the first time in the ER. I definitely would not have felt comfortable even attempting it before I had taken this course,” said Bryon Bellinger, ARNP, of Guttenberg Municipal Hospital. “I was also fortunate to have an Avel physician on camera helping me with it as well. I recommend [the course] to everyone.”

    Course highlights included:

    • Pediatric Airway Case Discussions

    • Surgical Airway Techniques

    • Bag-Valve Mask and Laryngoscopy Workshops

    • Code Airway Simulations

    • Video Laryngoscopy Skill Stations

    But training doesn’t stop at the end of the workshop. Avel eCare is committed to continuing education through its AVELearn platform, which provides ongoing access to clinical webinars, simulated learning, and accredited courses.

    “Beyond airway training, Avel eCare’s AVELearn platform provides a wide range of education opportunities tailored to the unique needs of our partners. Whether it’s accessing credit hours online, participating in live webinars, or engaging in simulated education, Avel eCare ensures that continuing education is accessible, practical, and integrated into our partnership” said Dr. Luke Van Oeveren, Avel eEmergency Physician.

    For Avel, this event reflects a broader mission: to empower clinicians with the tools, training, and telemedicine technology they need-whether they’re in a metro trauma center or a rural ER.

    About Avel eCare
    Avel eCare is one of the nation’s leading telemedicine providers, delivering 24/7 virtual clinical support across emergency care, ICU, behavioral health, pharmacy, hospitalist, and specialty services. Through innovative programs like AVELearn, Avel supports continuous education and skill development for healthcare teams, helping them deliver consistent, high-quality care-anytime, anywhere. Learn more at avelecare.com/education.

    Media Contact:
    Jessica Gaikowski
    Avel eCare
    media@avelecare.com

    SOURCE: Avel eCare

    View the original press release on ACCESS Newswire

    The post Avel eCare Hosts National Emergency Airway Course to Sharpen Life-Saving Intubation Skills appeared first on Local News Hub.

  • Arrive AI: Autonomous Delivery Set to Skyrocket as FAA Clears Flight Path for Drone Delivery

    Arrive AI: Autonomous Delivery Set to Skyrocket as FAA Clears Flight Path for Drone Delivery

    Indiana company says new drone regulations will speed improvements to package delivery security for Americans

    INDIANAPOLIS, IN / ACCESS Newswire / August 6, 2025 / Arrive AI (NASDAQ:ARAI), an autonomous delivery network anchored by patented AI-powered Arrive Points™, celebrated the Trump administration’s proposed new rule regarding drones flying Beyond Visual Line of Sight (BVLOS), that it said would unleash American innovation and safely integrate unmanned aircraft systems (UAS) into the national airspace system.

    The proposed rule would eliminate individual flight waivers and introduce key safety roles like Operations Supervisor and Flight Coordinator, helping commercial drone flights take off nationwide. U.S. Transportation Secretary Sean P. Duffy said the move would “unleash American drone dominance.”

    The announcement, made late yesterday, comes as Arrive AI is poised to roll out its solution for longstanding issues of security within the package delivery industry, a $191 billion market in the U.S. alone. Arrive AI’s patented Arrive Points anchor the company’s connected delivery network and proprietary technology, which enables secure, verifiable, and contactless delivery for drone, ground robot, or traditional human driver. The platform provides a secure chain-of-custody, ensuring every delivery is tracked and authenticated from the moment it enters an Arrive Point until it is retrieved.

    “This is a watershed moment,” said Dan O’Toole, founder and CEO of Arrive AI. “The proposed BVLOS rule brings us significantly closer to a future where drones, robots and AI-powered, smart delivery points work together to move goods securely, efficiently, and autonomously, particularly in healthcare, public safety, and rural last-mile logistics.”

    Arrive AI officials have long sought to loosen federal restrictions in the industry. “Other countries are ahead of us in using drones for delivery, and in the few cases in the U.S. where it’s been allowed, consumers love it,” O’Toole said.

    Arrive AI is already working with Skye Air Mobility, India’s dominant and rapidly expanding hyperlocal drone delivery platform. Skye Air currently makes about 6,000 deliveries per day in suburban New Delhi. The companies expect to have 500 Arrive Points across Skye Air’s service areas in the future, serving a population exceeding 33 million.

    FAA Administrator Bryan Bedford said normalizing drone flights “is key to realizing drones’ societal and economic benefits” for package delivery” and other uses.

    O’Toole said he is eager to see the rule approved and for Americans to have the same fast, convenient, more sustainable form of delivery.

    “This is the way of the future,” he said. “Arrive AI will make that last inch of the delivery process so much better for the delivery industry as well as users, who’ll be able to receive and return items with the touch of a button. They’re ready for this, and so are we.”

    -30-

    About Arrive AI

    Arrive AI’s patented Autonomous Last Mile (ALM) platform enables secure, efficient delivery to and from a smart, AI-powered mailbox, whether by drone, ground robot or human courier. The platform provides real-time tracking, smart logistics alerts and advanced chain of custody controls to support shippers, delivery services and autonomous networks. By combining artificial intelligence with autonomous technology, Arrive AI makes the exchange of goods between people, robots and drones frictionless and convenient. Its system integrates with smart home devices such as doorbells, lighting and security systems to streamline the entire last-mile delivery experience. Learn more at www.arriveai.com and via the company’s press kit.

    Media contact: Cheryl Reed at media@arriveai.com

    Investor Relations media@arriveai.com

    Contact: Alliance Advisors IR at ARAI.IR@allianceadvisors.com

    Cautionary Note Regarding Forward Looking Statements

    This news release and statements of Arrive AI’s management in connection with this news release or related events contain or may contain “forward-looking statements” within the meaning of Section 21E of the Securities Exchange Act of 1934, as amended, and the Private Securities Litigation Reform Act of 1995. In this context, forward-looking statements mean statements (including statements related to the closing, and the anticipated benefits to the Company, of the private placement described herein) related to future events, which may impact our expected future business and financial performance, and often contain words such as “expects”, “anticipates”, “intends”, “plans”, “believes”, “potential”, “will”, “should”, “could”, “would”, “optimistic” or “may” and other words of similar meaning. These forward-looking statements are based on information available to us as of the date of this news release and represent management’s current views and assumptions. Forward-looking statements are not guarantees of future performance, events or results and involve significant known and unknown risks, uncertainties and other factors which may be beyond our control. Readers are cautioned not to place undue reliance on these forward-looking statements, which apply only as of the date of this news release. Potential investors should review Arrive AI’s Registration Statement for more complete information, including the risk factors that may affect future results, which are available for review at www.sec.gov. Accordingly, forward-looking statements should not be relied upon as a predictor of actual results. We do not undertake to update our forward-looking statements to reflect events or circumstances that may arise after the date of this news release, except as required by law.

    SOURCE: Arrive AI Inc.

    View the original press release on ACCESS Newswire

    The post Arrive AI: Autonomous Delivery Set to Skyrocket as FAA Clears Flight Path for Drone Delivery appeared first on Local News Hub.